
Debugging a Zephyr RTOS Crash with Spotflow AI Analysis
When your Zephyr RTOS device crashes on your desk, you read the stack trace, find the root cause, and move on. When it crashes in the field, you get a report that the node rebooted. The serial cable is gone. The fault handler output is gone. All you know is that something went wrong at a time and place you cannot observe directly.
This post shows you how to instrument a Zephyr RTOS application so that when a crash occurs in the field, without a serial cable and without physical access, you have everything you need to identify the root cause: pre-crash warning logs that trace the path to the fault, a core dump with the full CPU and memory state, and an AI-generated explanation of what went wrong and where to look. The zephyr-crash-debugging example on GitHub provides a complete working reference. It runs on an NXP FRDM-RW612, and the three crash-report Kconfig lines, plus the required Spotflow base config and the device tree overlay, work on any Zephyr board supported by the Spotflow device module.
Key Takeaways
- Three Kconfig lines plus one board overlay.
CONFIG_SPOTFLOW_COREDUMPS=yenables automatic core dump collection, flash storage, and upload on the next boot. You also need to reserve acoredump-partitionin your board’s device tree overlay. - No code changes required. Spotflow integrates with Zephyr’s existing fatal error handler and core dump subsystem. Your application code stays the same.
- The AI analysis goes beyond the stack trace. Spotflow extracts register values, local variables, and global state from the core dump, then generates a plain-language explanation of what caused the fault and where to look in the code.
- The core dump survives reboot. It is stored in a dedicated flash partition before the device restarts, so it is available even if connectivity is lost at the moment of the crash.
The Bug: A Null Function Pointer in a Realistic Pattern
Consider a realistic firmware pattern: a temperature monitoring node with a conditionally registered alert callback. In a production firmware, some device variants are provisioned with an alert handler, for example a unit wired into a building management system. Other variants are sensor-only units that never register the callback. The processing path, shared across variants, calls the callback unconditionally whenever the temperature threshold is exceeded. When the callback was never registered, g_alert_callback is NULL, and the next call causes a fatal fault.
Conditionally registered callbacks called from shared paths are common in firmware that supports multiple hardware configurations. The code looks harmless in isolation. The bug only manifests on the specific variant that skips the registration step.
/* Not registered on this device variant. */
static alert_fn_t g_alert_callback = NULL;
static float      g_temp_threshold  = 40.0f;

static void check_threshold(float temp_celsius)
{
    if (temp_celsius > g_temp_threshold) {
        LOG_WRN("Temperature threshold exceeded: %.1f C (threshold: %.1f C)",
                (double)temp_celsius, (double)g_temp_threshold);
        /* NULL dereference: fatal fault on the next line */
        g_alert_callback(temp_celsius);
    }
}
For the demo, pressing the user button (SW2) lowers the threshold to 20 °C, below the simulated sensor range of 28–34 °C. After three sensor loop iterations, the threshold check fires, g_alert_callback is invoked, and the device faults.
Enabling Crash Collection: Three Crash-Report Kconfig Lines
Spotflow integrates with Zephyr’s native core dump subsystem. To enable crash collection, first turn on Spotflow itself, then add the three crash-report Kconfig lines to your prj.conf. For the full setup flow, see Crash reports with Zephyr. Device credentials belong in a separate credentials.conf that you exclude from version control:
# prj.conf
CONFIG_SPOTFLOW=y

# Enable core dump collection
CONFIG_SPOTFLOW_COREDUMPS=y
CONFIG_DEBUG_COREDUMP_MEMORY_DUMP_LINKER_RAM=y
CONFIG_DEBUG_COREDUMP_THREADS_METADATA=y
# credentials.conf (excluded from version control)
CONFIG_SPOTFLOW_DEVICE_ID="your-device-id"
CONFIG_SPOTFLOW_INGEST_KEY="your-ingest-key"CONFIG_SPOTFLOW_COREDUMPS=y does three things automatically: it enables Zephyr’s flash-backed core dump backend (DEBUG_COREDUMP_BACKEND_FLASH_PARTITION), overrides the default fatal error handler to reboot the device instead of halting it, and registers an on-boot check that uploads any pending core dump over MQTT/TLS before resuming normal operation.
Zephyr provides three choices regarding memory dump:
CONFIG_DEBUG_COREDUMP_MEMORY_DUMP_LINKER_RAM=ydumps the full statically allocated RAM image: global variables, static variables, and all data and BSS sections. This is the Zephyr default and what the example uses.CONFIG_DEBUG_COREDUMP_MEMORY_DUMP_THREADS=ycaptures the struct and stack of every running thread, plus all data the debugger needs to walk those stacks. Choose this when you need reliable stack inspection across all threads, not just the one that faulted. This mode is intended for devices where a full RAM dump would generate more data than can be reasonably stored or transmitted.CONFIG_DEBUG_COREDUMP_MEMORY_DUMP_MIN=ycaptures only the faulting thread and the bare minimum data to support stack walking. Use this only when flash space is severely constrained.
CONFIG_DEBUG_COREDUMP_THREADS_METADATA=y adds a thread metadata block to the dump, enabling thread-aware analysis with named threads and stack boundaries. It is independent of the memory dump mode and can be combined with any of them.
The sequence after a crash is:
- The fatal fault fires.
- Zephyr’s fault handler runs and writes the core dump to the flash partition.
- Spotflow’s reboot handler calls
sys_reboot(). - On the next boot, Spotflow detects the pending core dump, connects to Wi-Fi and MQTT, and uploads it in chunks.
- After a successful upload, the partition is erased.
The device never loses the core dump because it is written to flash before the reboot. Connectivity is not required at the moment of the crash.
The Flash Partition
Spotflow uses a dedicated flash partition to buffer the core dump between the crash and the next boot. You define it in your board overlay:
/* boards/frdm_rw612.overlay */

/delete-node/ &storage_partition;

&w25q512jvfiq {
    partitions {
        storage_partition: partition@620000 {
            label = "storage";
            reg = <0x00620000 0x037E0000>;
        };

        coredump_partition: partition@3e00000 {
            label = "coredump-partition";
            reg = <0x03e00000 DT_SIZE_M(2)>;
        };
    };
};
The overlay deletes the board’s default storage_partition and re-declares both partitions explicitly. This is necessary to shrink the storage area to make room for the coredump partition at the end of the flash chip.
The partition size depends on how much RAM you want to capture. For the full RAM dump on the FRDM-RW612 (960 KB usable RAM), 2 MB provides enough headroom for a complete dump with the Zephyr core dump header overhead. For non-LINKER_RAM dump modes, 64–128 KB is typically sufficient.
The label = "coredump-partition" name is required: Zephyr’s core dump backend looks for this label by name.
The Crash Sequence
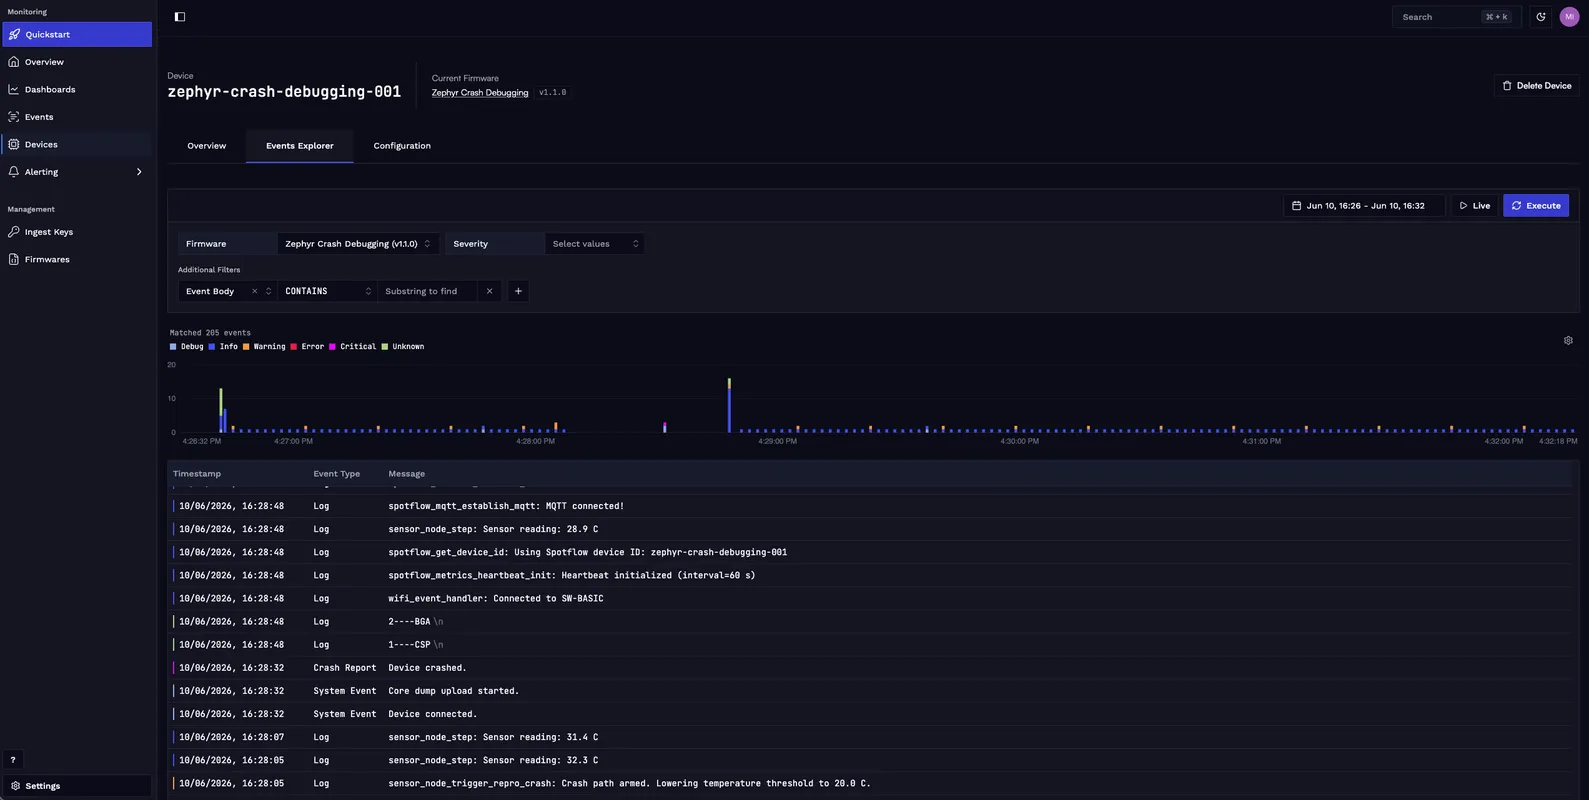
Press SW2 to trigger the crash path. Your local serial/RTT output shows the full sequence leading up to the fault:
[00:54:37.887,448] <wrn> main: button_pressed: User button pressed. Arming reproducible crash path.
[00:54:37.887,475] <wrn> sensor_node: sensor_node_trigger_repro_crash: Crash path armed. Lowering temperature threshold to 20.0 C.
[00:54:38.007,375] <inf> sensor_node: sensor_node_step: Sensor reading: 32.3 C
[00:54:40.007,600] <inf> sensor_node: sensor_node_step: Sensor reading: 31.4 C
[00:54:42.008,043] <inf> sensor_node: sensor_node_step: Sensor reading: 28.9 C
[00:54:42.008,092] <wrn> sensor_node: check_threshold: Temperature threshold exceeded: 28.9 C (threshold: 20.0 C)
[00:54:42.008,140] <err> os: usage_fault: ***** USAGE FAULT *****
[00:54:42.008,265] <err> os: z_fatal_error: >>> ZEPHYR FATAL ERROR 35: Unknown error on CPU 0
[00:54:50.961,091] <err> spotflow_coredump: k_sys_fatal_error_handler: Halting system
Each line traces a step in the fault path: the button press arms the crash path and lowers the threshold; the sensor readings confirm the temperature is above the new threshold; the final <wrn> from check_threshold shows the exact value that triggered the callback invocation. The core dump captures all of this context in memory at the moment of the fault.
After the USAGE FAULT line, the fault handler saves the core dump to the flash partition and the device reboots. On the next boot, Spotflow’s on-boot thread uploads the core dump before the application resumes normal operation:
*** Booting Zephyr OS build 684c9e8f32e4 ***
[00:54:55.479,157] <inf> main: main: Zephyr crash debugging example starting
[00:54:57.483,911] <inf> sensor_node: sensor_node_init: Sensor node ready. Press the user button to reproduce the crash.
[00:55:04.408,370] <inf> spotflow_sample_wifi: wifi_event_handler: Connected to SW-BASIC
[00:55:06.551,034] <inf> spotflow_net: spotflow_mqtt_establish_mqtt: MQTT connected!
[00:55:14.210,594] <inf> spotflow_coredump: spotflow_coredumps_thread_entry: All coredump chunks enqueued
[00:55:14.471,123] <inf> spotflow_coredump: spotflow_poll_and_process_enqueued_coredump_chunks: Coredump successfully sent.
The core dump is stored in flash before the reboot, so connectivity is not required at the moment of the crash. On the next boot, Spotflow uploads it before the application starts, ensuring the crash data reaches your dashboard even if the device is unattended.
AI Crash Analysis in Spotflow
Before opening the crash report, upload your zephyr.elf to Spotflow via the Firmware Management page. Without it, stack frames show only raw addresses and symbol names cannot be resolved in the crash report. See Upload ELF file with symbols for step-by-step instructions.
Once the core dump is uploaded, Spotflow processes it automatically. You can open the crash event from the Events page by filtering for the device ID and the crash report event type.
The analysis extracts the following from the core dump:
- Stack traces across all running threads, with function names resolved from the ELF symbol table.
- Register values and local variables for each stack frame.
- Global variable state at the time of the fault.
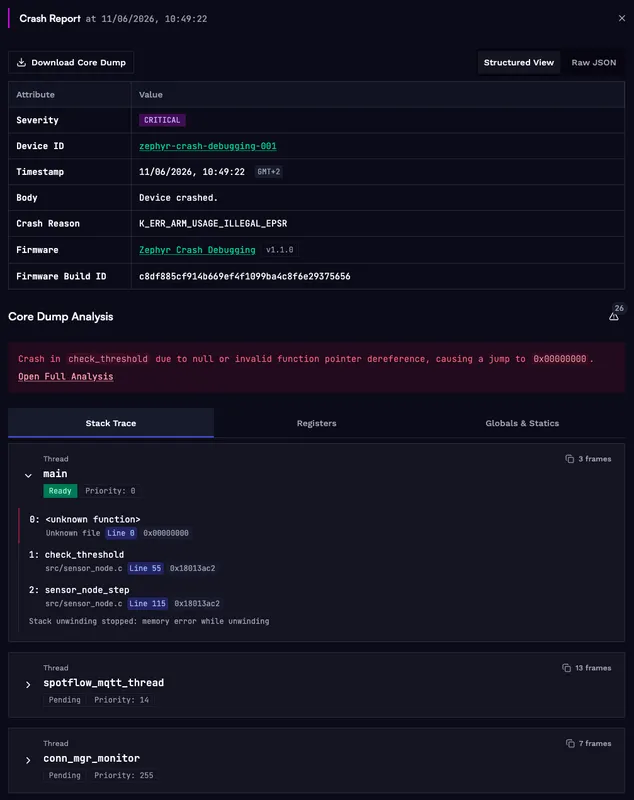
In the crash report, look for the thread whose call stack ends at the faulting function. The register dump will show the PC value the CPU attempted to branch to at the moment of the fault. A PC value of 0x00000000 is the signature of a null function pointer call: the CPU branched through an uninitialized pointer and tried to execute from address zero, which Zephyr reports as an illegal use of the EPSR.
The AI analysis adds a plain-language summary of the root cause. It identifies the faulting function, explains that branching to 0x00000000 is typical of a null or invalid function pointer, and recommends auditing the call site and any initialization paths for missing pointer checks or unregistered callbacks.
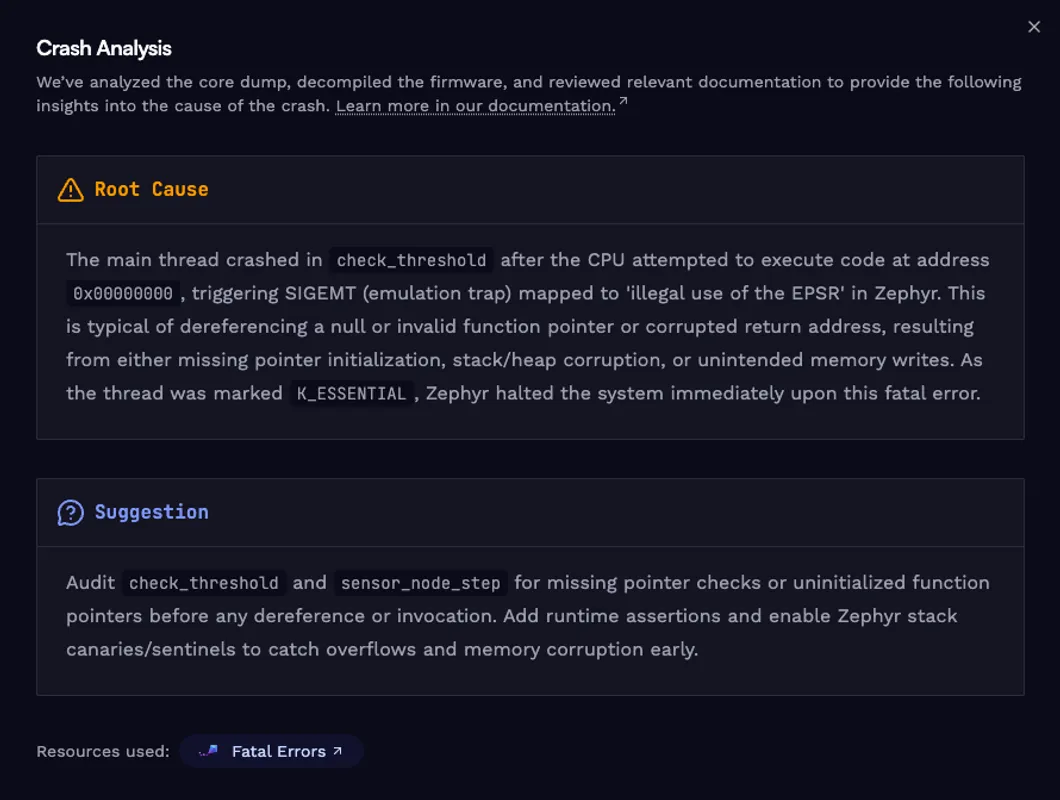
That level of context turns a crash you could not observe into a specific code path to audit. Instead of starting from a raw fault address, you start from the exact function, the call site, and the global state that led there.
Applying This to Your Project
The patterns in this post are not specific to the FRDM-RW612. Add CONFIG_SPOTFLOW_COREDUMPS=y and the coredump-partition overlay to any Zephyr board supported by the Spotflow device module. Add LOG_WRN before any callback invocations or conditional code paths that could trigger a fault. Everything else is handled automatically.
The complete reference implementation is in the zephyr-crash-debugging directory. The README covers the full setup: west workspace, NXP binary blobs, build, and flash. The example builds with west build and flashes with west flash.
Conclusion
Collecting Zephyr core dumps in the field requires enabling Spotflow, adding three crash-report Kconfig lines, defining a flash partition, and establishing an MQTT connection on the next boot. Everything else (the fault handler override, the core dump storage, the upload, and the AI analysis) is handled by the Spotflow device module automatically.
The result is that a crash you cannot observe at the time it happens becomes a crash you can investigate thoroughly afterward. The log stream shows what changed immediately before the fault. The core dump shows the CPU state at the moment of the fault. The AI analysis explains the root cause in context, connecting the invalid branch address back to the application code path that triggered it.
Ready to get started? Sign up for Spotflow, no credit card required.
Explore the documentation to go deeper:
- Crash reports with Zephyr
- Fundamentals: Crash reports & core dumps
- Fundamentals: Firmware management
- Metrics with Zephyr
- Logging with Zephyr
- zephyr-crash-debugging on GitHub
Questions or feedback? Reach out on Discord or email hello@spotflow.io.