
Send Logs from Zephyr to the Cloud with Spotflow
When you’re developing firmware on Zephyr RTOS, LOG_INF() over UART is usually the first debugging approach you reach for. It works well on your desk with a single board and a serial terminal. But once your devices ship to the field, that serial cable is gone, and with it, your visibility into what the firmware is actually doing. Crashes happen with no stack traces. Log messages disappear. Intermittent bugs become impossible to reproduce.
This post walks through connecting an NXP FRDM-RW612 board running Zephyr to the Spotflow observability platform using Spotflow Zephyr logging example. By the end, your device will be streaming logs to the cloud while still printing them on UART, with no changes to your application code.
Key Takeaways
- No vendor lock-in on the device side. Spotflow implements a custom Zephyr logging backend that captures standard
LOG_DBG(),LOG_INF(),LOG_WRN(), andLOG_ERR()macros and transmits them to the cloud. - Your local debugging workflow stays the same. The Spotflow logging backend runs alongside UART, so you see logs locally and remotely at the same time.
- Zephyr logging example application included. The Spotflow module includes a logging example that you can build and flash in minutes to get started.
The Problem with Zephyr Logging and Debugging in the Field
Zephyr’s logging subsystem works well on the bench: connect a probe, open a serial terminal, and watch LOG_INF() messages scroll by. But once devices are deployed, that serial cable is gone. Crashes leave no stack trace. Intermittent bugs across a fleet of 500 devices become invisible. Heap usage creeps up on a subset of boards with no one watching.
Tools like J-Link, RTT, and UART are designed for single-device, bench-level debugging. GDB can connect remotely over TCP/IP, and UART can be bridged over a network, but neither approach scales to fleet-wide monitoring without significant custom infrastructure per device.
What you need in production is a system that passively collects logs, crash data, and metrics from every device and makes them searchable from a single interface. A cloud-based observability platform does exactly that, it adds a remote backend to your existing Zephyr logging workflow, forwarding the same LOG_INF() calls you already write to a cloud service.
In this blog post, we use Spotflow to add remote logging to an NXP FRDM-RW612 board. Spotflow is an observability platform built for embedded devices. It integrates with Zephyr as a standard west module that hooks into native Zephyr subsystems (logging, core dumps) via Kconfig. Your application code stays the same, you keep calling LOG_INF() and other standard Zephyr APIs, and Spotflow captures the data without any Spotflow-specific calls in your source.
Here is a Zephyr logging example that demonstrates the standard log macros. This is the same code you would write whether or not Spotflow is enabled, no Spotflow-specific headers, no custom APIs:
#include <zephyr/bindesc.h>
#include <zephyr/kernel.h>
#include <zephyr/logging/log.h>
#include "net.h"

LOG_MODULE_REGISTER(MAIN, LOG_LEVEL_INF);

int main(void)
{
    LOG_INF("Device has booted up successfully.");

    for (int i = 1; i <= 5; i++) {
        int reading = i * 10;
        LOG_INF("Sensor reading %d: %d units", i, reading);

        if (reading > 30) {
            LOG_WRN("Reading is above normal. Value: %d.", reading);
        }
    }

    LOG_ERR("Simulated error for demonstration purposes.");
    LOG_INF("Device shutting down.");

    return 0;
}
How the Zephyr Logging Backend Works
If you have used Zephyr logging before, you know the basic architecture: your code calls a log macro, the logging subsystem formats the message, and one or more backends output it. The UART backend prints to serial. Spotflow adds another backend to the same chain.
Here is the data flow:
- Your code calls
LOG_INF(),LOG_WRN(),LOG_ERR(), orLOG_DBG(). - Zephyr’s logging subsystem formats the message and dispatches it to all enabled backends.
- The Spotflow backend serializes the log entry using CBOR (Concise Binary Object Representation), an efficient binary encoding well-suited for constrained devices, and places it in a transmission queue.
- A dedicated MQTT thread picks up queued entries and sends them to
mqtt.spotflow.ioover TLS on port 8883, using MQTT QoS 0. - If the network is unavailable, entries accumulate in a circular buffer. When connectivity is restored, buffered logs are sent automatically. Oldest entries are dropped if the buffer fills up.
The important point: this is not a replacement for UART logging. Both backends run simultaneously. You still see the same output on your serial terminal. Spotflow just adds a second path that sends those messages to the cloud.
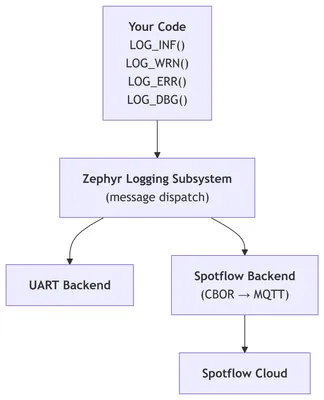 Spotflow as a backend in the Zephyr logging subsystem.
Hardware and Development Setup for Zephyr Remote Logging
Board: NXP FRDM-RW612, an ARM Cortex-M33 MCU running at 260 MHz with 1.2 MB on-chip SRAM, Wi-Fi 6, BLE 5.3, and 802.15.4. The built-in Wi-Fi makes it convenient for connecting to Spotflow without additional networking hardware.
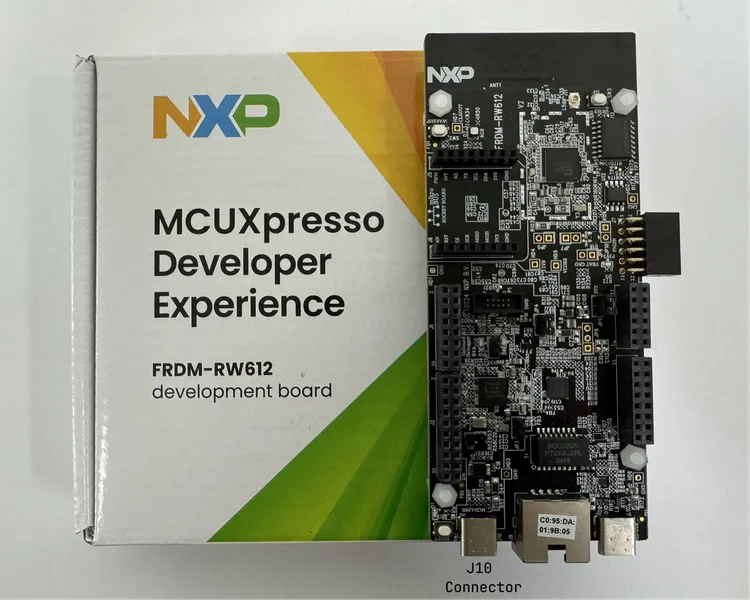 NXP FRDM-RW612 board.
Development environment:
This example works on Windows, Linux, and macOS, with all three platforms supported equally well. The only differences are in the shell used (for example, Bash vs. PowerShell).
On the FRDM-RW612, connect a USB cable from your PC to the J10 connector (USB-C port to the left of the Ethernet port), and use the serial terminal of your choice (minicom, PuTTY, Serial Monitor from Microsoft, etc.) with the following settings:
- Speed: 115200
- Data: 8 bits
- Parity: None
- Stop bits: 1
Zephyr Logging Example Application: Connect Your Device to Spotflow in 4 Steps
Spotflow is distributed as a west module, which is the standard mechanism for managing external dependencies in Zephyr. The integration does not require patching the Zephyr kernel or modifying your application’s logging code.
Step 0: Sign Up for Spotflow
Before you can use Spotflow, you need to create an account. Sign up for free at https://app.spotflow.io/signup. After signing up, you can manage your ingest keys from the Ingest Keys page. This key will be used to authenticate your device when it connects to the Spotflow cloud.
Step 1: Prerequisites
If you don’t have Zephyr dependencies already installed, refer to the official Getting Started Guide for the instructions on how to install them for your operating system.
Step 2: Create the West Workspace
Spotflow provides an automated setup script. The following script will guide you through the creation of a new workspace that contains the Spotflow module and sample applications.
Open terminal and run the following command:
Invoke-Expression "& {$(Invoke-RestMethod -Uri 'https://downloads.spotflow.io/spotflowup.ps1' -UseBasicParsing) } -zephyr -board frdm_rw612"source <(curl --proto '=https' --tlsv1.2 -sSf https://downloads.spotflow.io/spotflowup.sh) --zephyr --board frdm_rw612Alternatively, you can create the workspace manually by following these steps.
Step 3: Configure the Zephyr Logging Example Application
The Spotflow module includes a logging example application. Open the configuration file at <workspace-folder>/modules/lib/spotflow/zephyr/samples/logs/prj.conf and fill in your settings based on your network connection type.
Wi-Fi:
# Network configuration
CONFIG_NET_WIFI_SSID="<Your Wi-Fi SSID>"
CONFIG_NET_WIFI_PASSWORD="<Your Wi-Fi password>"

# Spotflow configuration
CONFIG_SPOTFLOW_DEVICE_ID="frdm-rw612-001" # Set unique identifier of your device
CONFIG_SPOTFLOW_INGEST_KEY="<your-ingest-key>"
Ethernet:
# Network configuration
CONFIG_SPOTFLOW_USE_ETH=y

# Spotflow configuration
CONFIG_SPOTFLOW_DEVICE_ID="frdm-rw612-001" # Set unique identifier of your device
CONFIG_SPOTFLOW_INGEST_KEY="<your-ingest-key>" # Set your Spotflow ingest key
If you’re using Ethernet, make sure the Ethernet cable is plugged into the board and the network has internet access.
Step 4: Build, Flash, and Run the Zephyr Logging Example
Now, you are ready to build and flash your application to the device and start sending logs to Spotflow:
cd modules/lib/spotflow/zephyr/samples/logs
west build --pristine --board frdm_rw612
west flash
If you open the UART output from the device, it should be similar to this one:
[00:00:00.098,461] <dbg> spotflow_logging: init: Initializing spotflow logging backend
[00:00:02.825,807] <inf> fs_nvs: nvs_mount: 8 Sectors of 4096 bytes
[00:00:02.825,947] <inf> spotflow_net: spotflow_config_persistence_try_load: Persisted Spotflow configuration loaded
[00:00:02.825,976] <inf> spotflow_logging: init: Spotflow logging backend initialized.
*** Booting Zephyr OS build 3568e1b6d5cd ***
[00:00:03.600,676] <inf> MAIN: main: Starting Spotflow logging example
[00:00:03.601,122] <inf> spotflow_net: wait_for_network: Waiting for network...
[00:00:04.600,860] <inf> spotflow_sample_wifi: connect_to_wifi: Connecting to SSID: YourWiFiNetwork
[00:00:05.605,147] <inf> MAIN: main: Hello from Zephyr to Spotflow: 0
[00:00:07.605,285] <inf> MAIN: main: Hello from Zephyr to Spotflow: 1
...
[00:00:15.502,302] <dbg> spotflow_net: l4_event_handler: Network connectivity established and IP address assigned
[00:00:16.751,104] <dbg> spotflow_net: mqtt_evt_handler: MQTT client connected!
[00:00:16.751,190] <inf> spotflow_net: spotflow_mqtt_establish_mqtt: MQTT connected!
Once you see MQTT connected!, the device is streaming logs to Spotflow. The key thing to notice is that the same LOG_INF() messages appearing on UART are also being forwarded to the cloud. The Spotflow logging backend runs alongside the standard UART backend, so your local debugging workflow is unchanged.
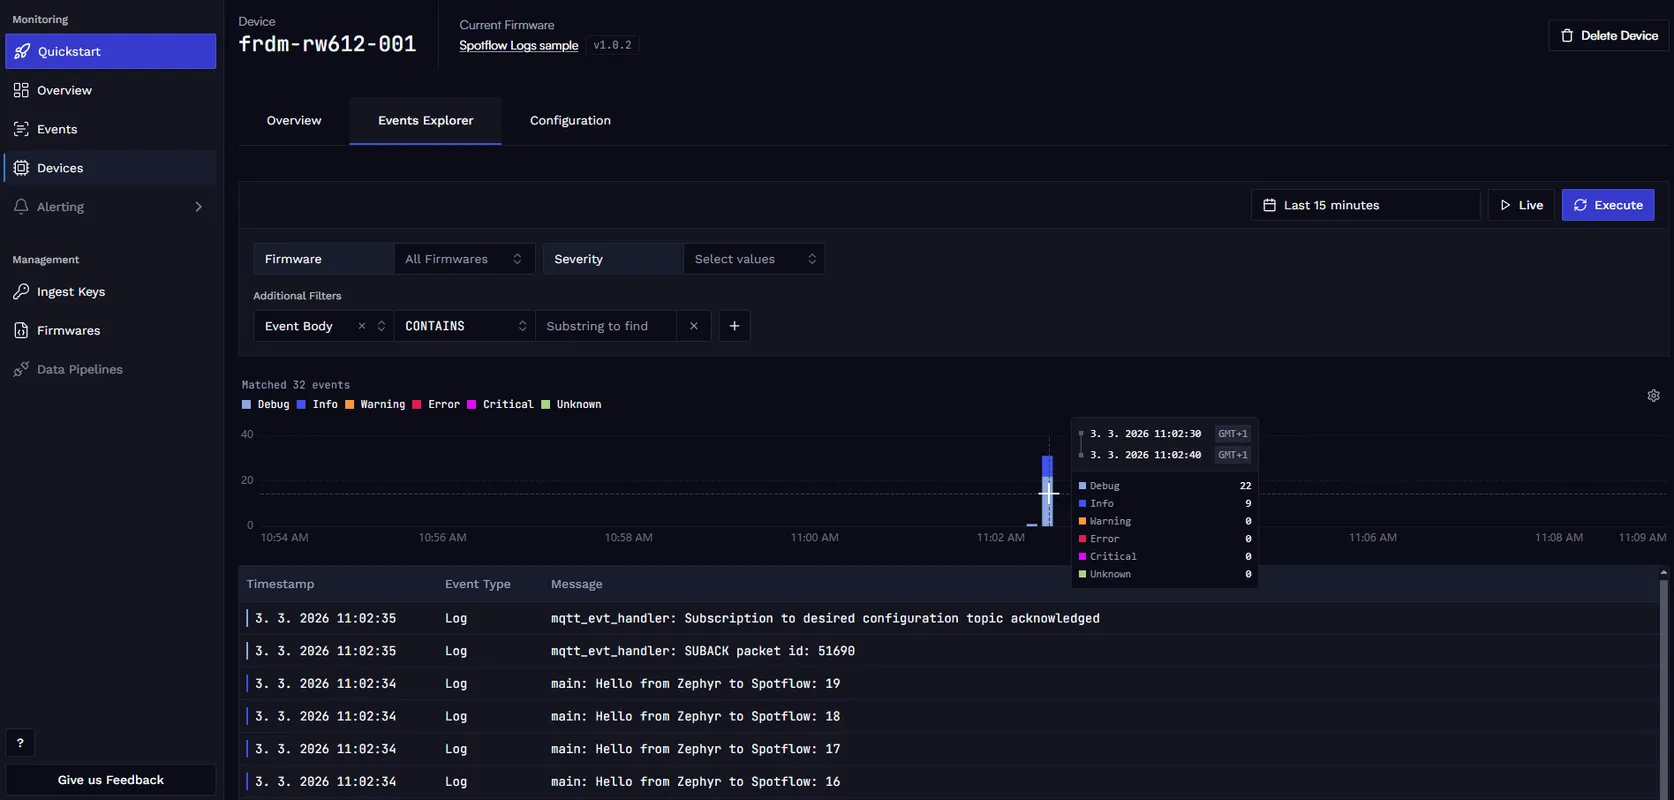
In the Spotflow web application, you should see your device appear in the devices list. You can click into it and open Events Explorer to view the live log stream, which includes all the same log messages you see on UART, but with additional metadata like timestamps, log levels, and more powerful search and filtering capabilities.
Conclusion
Spotflow adds remote logging to your Zephyr application without changing your existing code. The same LOG_INF(), LOG_WRN(), LOG_ERR(), and LOG_DBG() calls you already write are captured by the Spotflow backend and sent to the cloud, while still printing to UART for local debugging. The included example application gets you up and running in minutes, and the platform provides powerful tools for searching, filtering, and analyzing logs from your fleet of devices.
Ready to get started? Sign up for Spotflow, no credit card required. Follow the Zephyr Integration Quickstart for the full reference documentation.
Questions or feedback? Reach out on Discord or email hello@spotflow.io.