
Debugging ESP32 Devices in the Field
When you are debugging an ESP32 on your desk, a UART terminal usually gives you enough context to keep moving. You see the boot log, watch the Wi-Fi connection come up, and notice the warning that appeared right before the fault.
That workflow breaks down in the field. The serial cable is gone. The device reboots before anyone is watching. By the time you hear about the incident, all you have is a report that “the node restarted again.”
This post walks through a practical field-debugging workflow for Zephyr-based ESP32 devices using Spotflow. The esp32-industrial-sensor-observability sample on GitHub provides a concrete reference throughout, but the workflow itself applies to any device you already instrument. The goal is to show how to combine logs, metrics, alerts, and crash reports into one investigation workflow that still works when the board is no longer within arm’s reach.
Key Takeaways
- Logs tell you what changed first. They show whether the failure started during bring-up or after the device had already established its connection, and which warning appeared first in the sequence.
- Metrics show degradation. Failure-specific application metrics are more useful than a restart counter on its own.
- Alerts should fire before the reboot. A useful rule catches the degrading pattern, not just the aftermath.
- Crash reports explain the fatal fault. They show where the CPU stopped, what was on the call stack, and the register state at the time of the crash.
- Together, the four instruments form one workflow. Logs answer “what changed first?”, metrics answer “what was degrading?”, alerts answer “when should I have known?”, and crash reports answer “where did it finally die?”
The screenshots and log traces throughout this post come from esp32-industrial-sensor-observability, a Zephyr application for ESP32-C3, C6, and S3 that simulates a sensor node developing a realistic failure pattern. The node reads from a simulated sensor head, uploads telemetry batches, and reports application metrics to Spotflow over MQTT/TLS. While running, it periodically emits warning signs that model real-world sensor and connectivity issues, and can be triggered to crash deterministically on a malformed telemetry frame. You can run it on real hardware and watch the failure unfold in Spotflow in real time.
Why a Restart Counter Is Not Enough
A restart counter is the most common first signal added to embedded telemetry. It tells you that a failure occurred. It does not tell you what caused it.
The first useful signal in this example is not boot_reset. It is the pattern before the restart: CRC mismatches from the remote probe head, repeated uplink retries, a growing sensor backlog, and stale data accumulating before the device finally gave up. A restart counter captures only the last of those events.
Watching only the crash artifact gives you the other half of the same problem. You learn where the CPU stopped, but not whether the failure started as a sensor-side corruption issue, a connectivity problem, or a backlog that had been building for several minutes.
That is why this workflow uses logs, metrics, and crash reports reported by the device, with alert rules configured in Spotflow on top of those metrics. Together, they explain what changed first, what degraded over time, and where the application finally crashed.
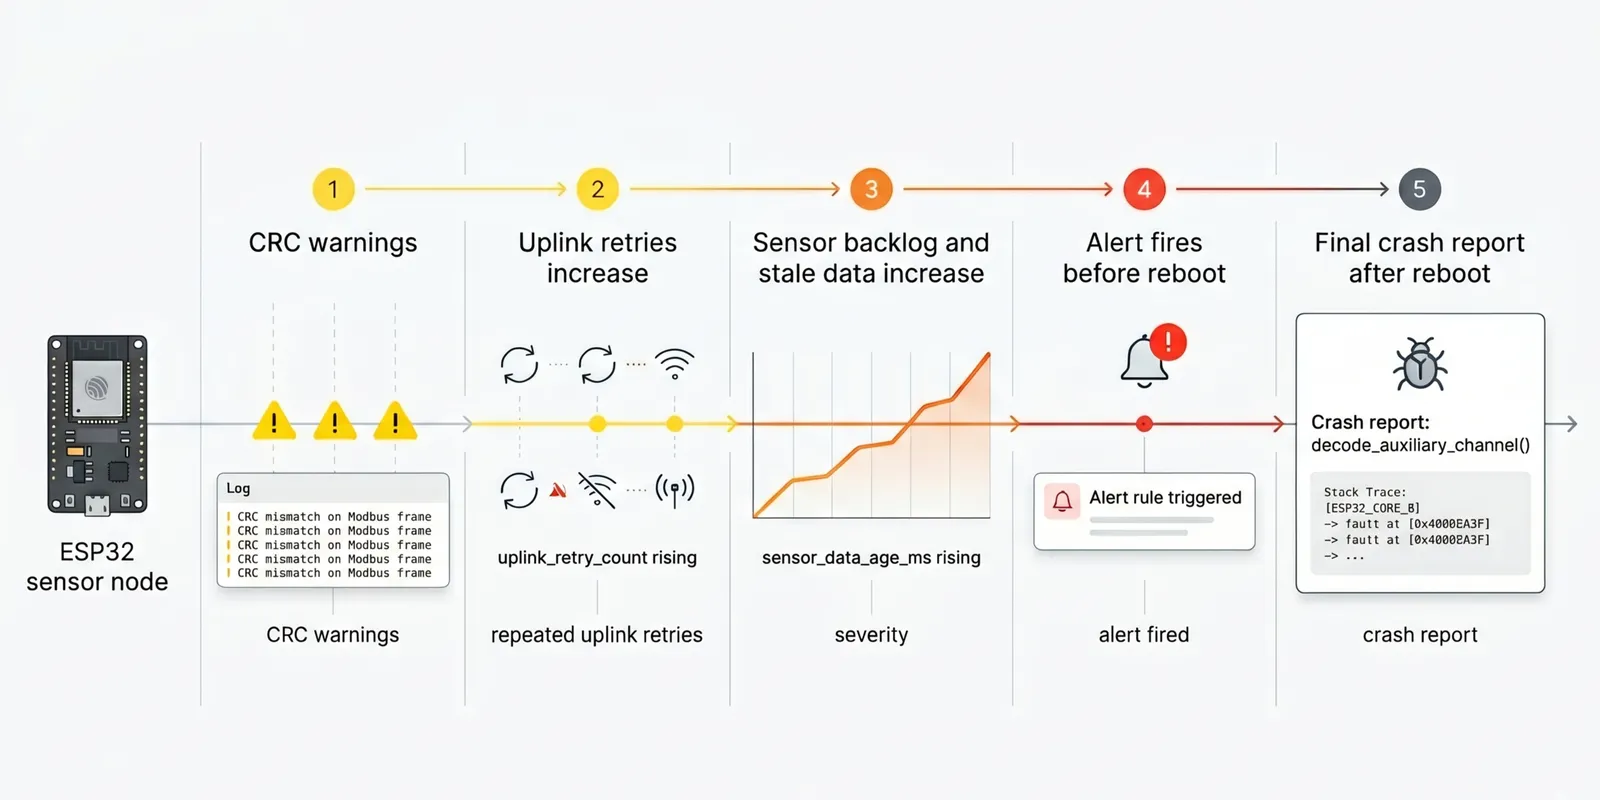 Timeline of an ESP32 sensor node failure, showing CRC warnings, uplink retries, rising sensor_data_age_ms, an alert firing, and the final crash report.
Instrument Your Firmware for Observability
Before Spotflow can show you anything useful, your firmware needs to tell it something meaningful.
That starts with choosing the right things to report. Generic health signals like heap free, uptime, and reset cause tell you whether a device is alive. They do not tell you what the device is struggling with. Failure-aware instrumentation means adding signals that reflect the specific failure paths your application could actually take.
For logging, use severity levels deliberately. INFO should mark normal state transitions: connected, session started, first measurement uploaded. WARNING should cover recoverable anomalies like a CRC mismatch, a retry, or a backlog spike. ERROR should be reserved for paths that either require immediate attention or lead directly to a reset. When severity is used consistently, filtering by level in the Events page gives you a meaningful signal immediately.
For metrics, prefer application-layer signals over system counters alone. If you want to detect a pipeline falling behind before the device gives up, track sensor_data_age_ms. If you want to know that connectivity is degrading before it fails completely, track uplink_retry_count. If you want to catch corrupted frames entering the system before they cause a crash, track sensor_read_failures. These signals reflect the actual failure paths, not just whether the device is still alive.
When a crash does occur, crash reports let you debug deeply into what was happening on the device at the time. Spotflow extracts stack traces across all threads, register values and local variables for each stack frame, and the state of global variables at the moment of the fault. Together with AI-assisted analysis, this gives you the context needed to understand not just where the CPU stopped, but why.
The practical result: logs give you sequence, metrics give you trend, alerts turn trend into early warning, and crash reports give you deep visibility into the crash itself. Each layer answers a different question. Together, they reconstruct what happened.
Logs Show What Changed First
Logs answer two questions that no other signal can: did the failure happen during bring-up, or after the MQTT connection was already established? And when the failure did develop, what changed first?
To answer the first question, log the connectivity sequence at INFO level. A clear record of Wi-Fi association, device identification, and MQTT handshake lets you establish connection timeline immediately. If the last INFO entry in the stream is somewhere in that sequence, the crash happened during bring-up or reconnect. If the stream continues past MQTT connected!, the connection was up and the failure developed afterward. In the sample, these entries mark the transition to a healthy connection:
Connecting to SSID: <your-ssid>Connected to <your-ssid>Using Spotflow device ID: <your-device-id>MQTT connected!
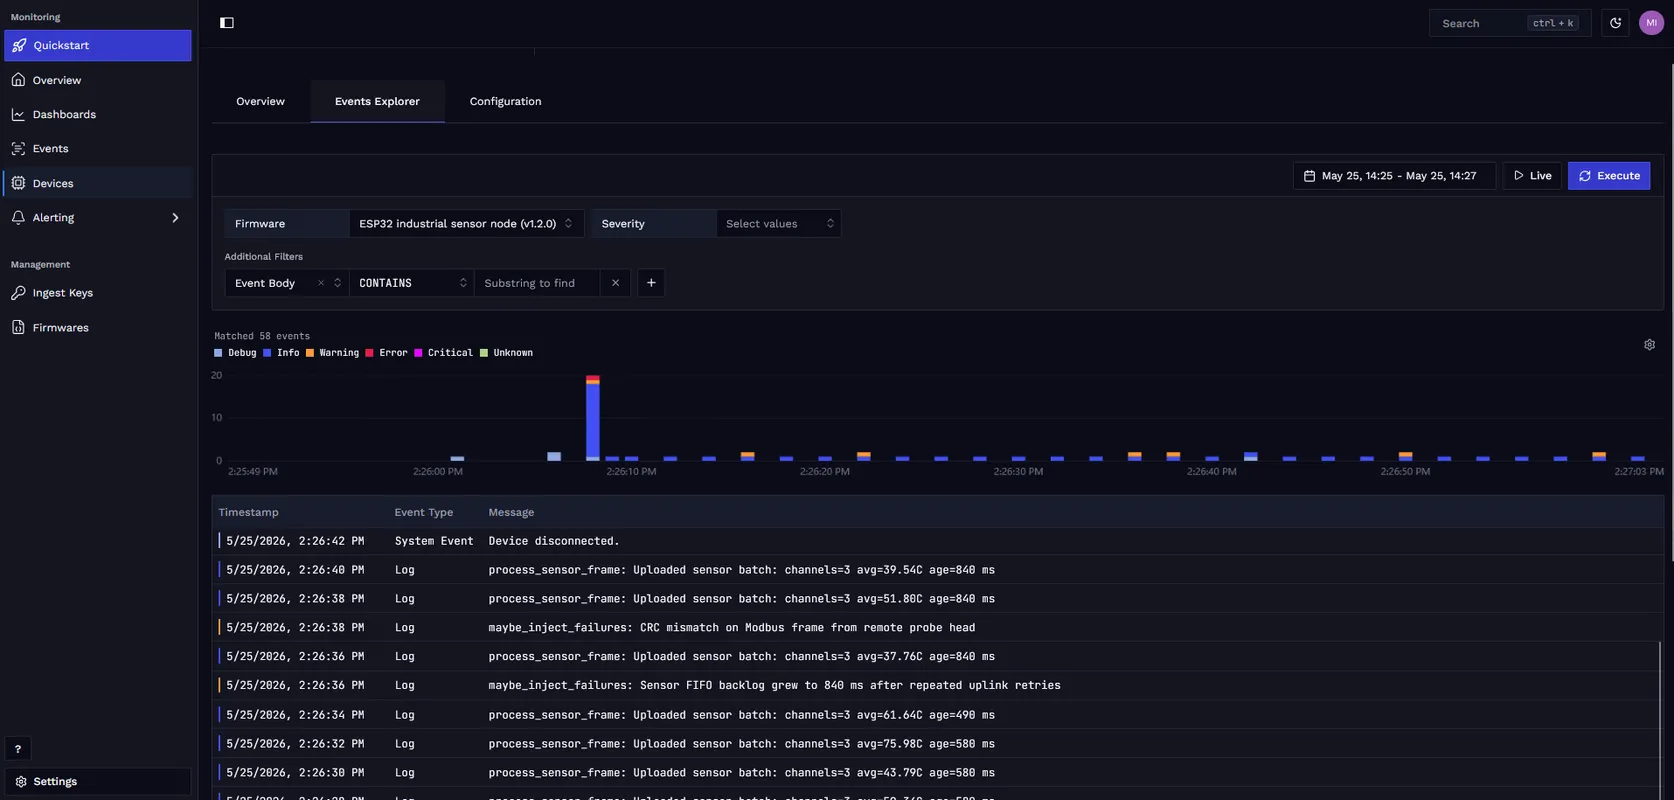
To answer the second question, log every recoverable anomaly at WARNING level. CRC mismatches, retries, and backlog growth are the events that precede a crash without causing one on their own. Logging them at WARNING gives you a record of what changed first, separate from the noise of normal operation. In the sample, two entries carry the failure story:
CRC mismatch on Modbus frame from remote probe headSensor FIFO backlog grew to ... ms after repeated uplink retries
In the Events page, filter by the device ID and set the severity to WARNING and above. The ordering of those entries is the story: the CRC mismatch appears before the backlog warning, which tells you the input side degraded before the upload side fell behind.
For the full Zephyr integration behind this log stream, see Logging with Zephyr.
Metrics Show What Was Degrading
Logs tell you what happened. Metrics tell you whether it was an isolated event or a trend that had been building over time.
For each failure path in your application, instrument a metric that would reveal it early. For a sensor node failure like this one, that means tracking the pipeline backlog, the connectivity pressure, the input error rate, and individual cycle duration alongside the application restart count:
| Signal | What question it answers |
|---|---|
sensor_data_age_ms rising | is the pipeline falling behind before the upload fails? |
sensor_cycle_duration_ms drifting | are individual sensor cycles taking longer, suggesting resource pressure? |
uplink_retry_count incrementing | is connectivity or broker pressure getting worse? |
sensor_read_failures incrementing | are malformed or corrupted frames entering the system? |
boot_reset firing | has the device crossed from degraded into unstable? (boot_reset is a system metric reported automatically by the Spotflow module on every boot, with no application code required) |
This is the difference between generic health telemetry and failure-aware instrumentation. You are not only collecting heap free, reset cause, and network state. You are instrumenting the failure path itself.
Spotflow collects system health metrics automatically through the device module: heap usage, CPU utilization, thread stack pressure, network TX/RX bytes, MQTT connection state, and reset cause. These appear in the built-in Device Dashboard and Overview Dashboard. Application-specific signals like these can then be explored in the same views or broken out into custom dashboards.
The key idea is simple: system metrics answer “Is the device healthy?” Application metrics answer “What is this device struggling with right now?”
With these metrics in place, a compact custom dashboard makes the failure pattern readable at a glance. In the sample, sensor_data_age_ms climbs as the pipeline falls behind, uplink_retry_count and sensor_read_failures track the degrading path, sensor_cycle_duration_ms drifts upward, and boot_reset marks the eventual reboot.
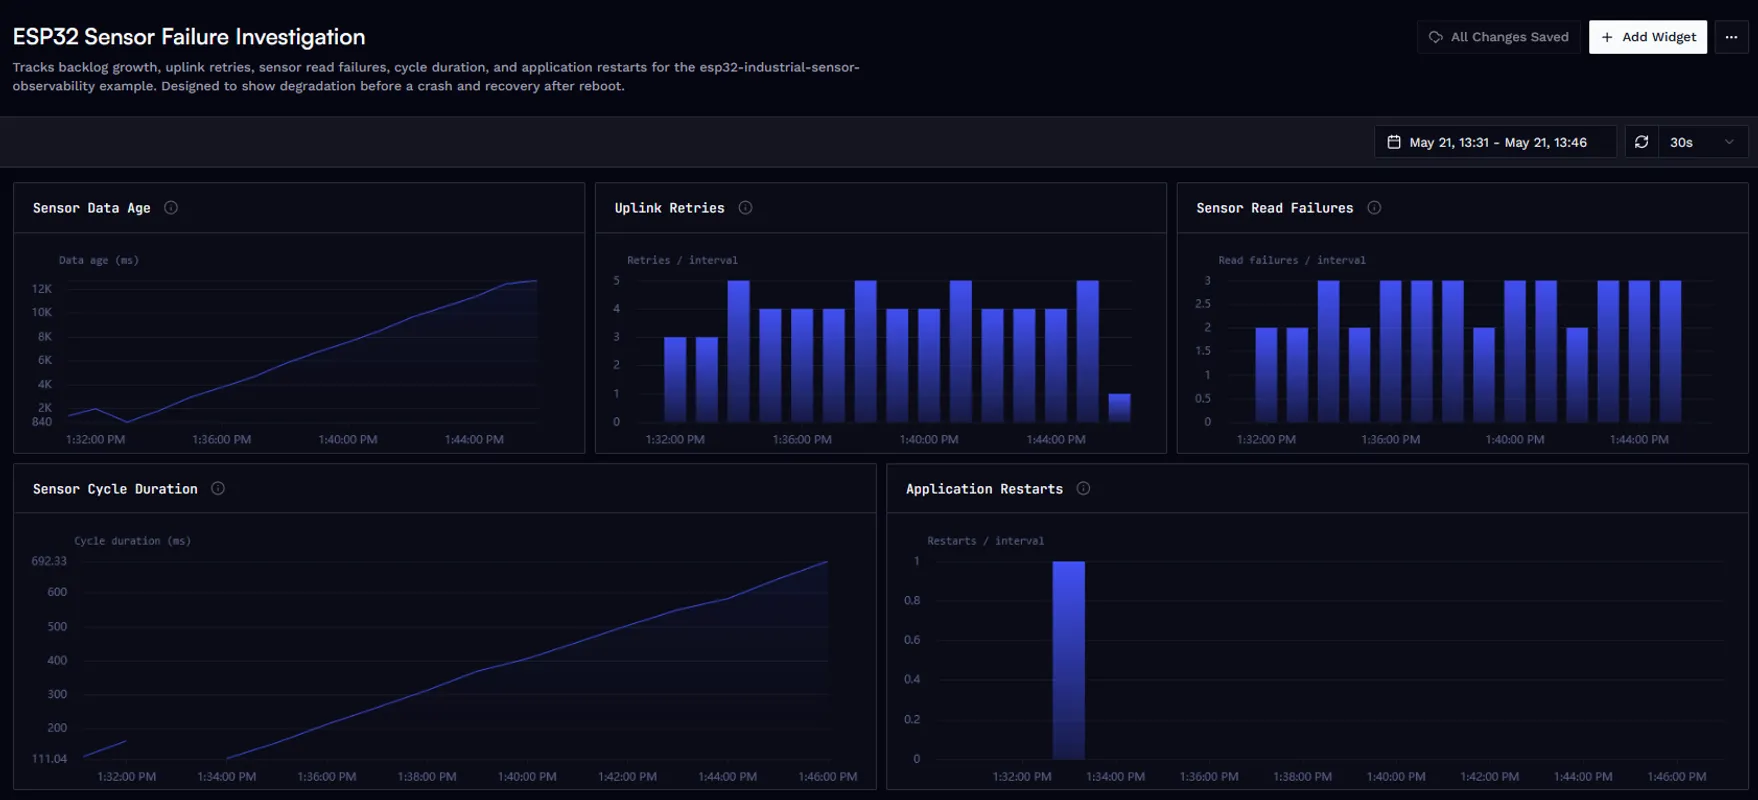
Custom dashboard for the ESP32 sensor node. Rising sensor_data_age_ms, repeated retries, and read failures make the degrading path visible before boot_reset confirms the reboot.
Alerts Should Trigger Before the Reboot
If your device is already reporting these metrics, turning monitoring into something operational is a matter of creating alert rules in the Spotflow web app.
Once the metrics above are in place, create threshold rules in the Spotflow web app to make the degradation visible before a reboot occurs. A threshold rule on sensor_data_age_ms > 1000 over a 10-minute evaluation window, grouped by device ID, fires when the sensor pipeline starts falling behind. This is the most valuable rule to create first: it triggers while the device is still running and degrading, not after the reboot has already hidden the lead-up. A rule on sensor_read_failures > 0 over the same 10-minute window catches malformed or corrupted frames as soon as they start appearing. A rule on boot_reset > 0 over the last hour confirms that the device has crossed from degraded into unstable. boot_reset is the Spotflow system metric for reset cause, collected automatically by the device module on every boot, with no registration or reporting code needed in the application.
The exact threshold of 1000 ms is a starting point for this scenario. The important part is the evaluation window and the grouping: when the query is grouped by device ID, an alert fires for any individual device that crosses the threshold, not for a fleet-wide aggregate. Start with exact rules so the workflow is reproducible, then tune the thresholds for your real fleet. For guidance on creating threshold rules and notification targets, see Fundamentals: Alerts and Guide: Set Up Alerts.
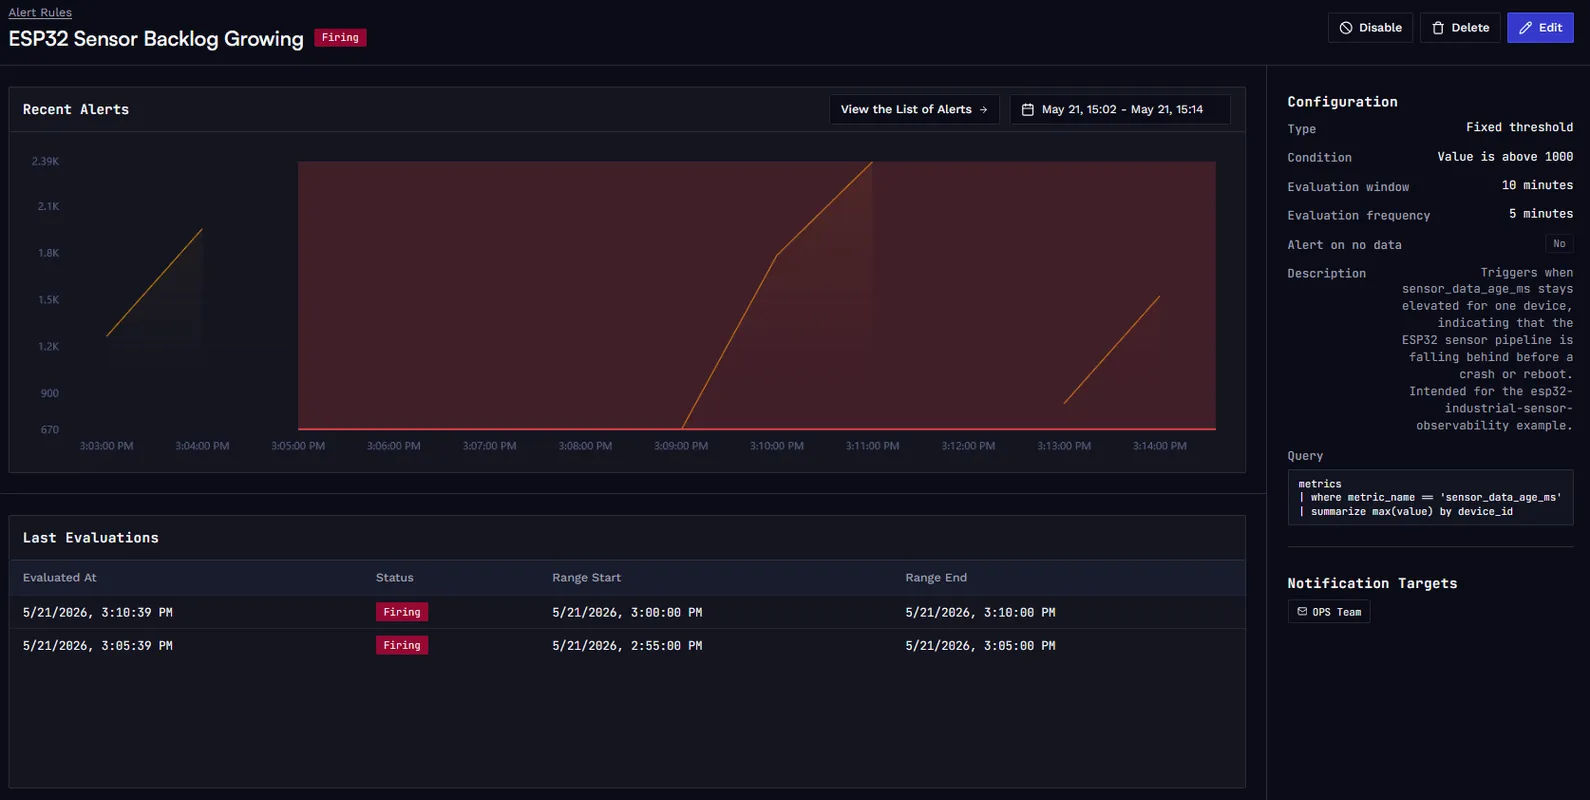
Alert rule for the ESP32 sensor node. This rule evaluates the maximum sensor_data_age_ms per device over a 10-minute window and fires when backlog growth crosses the 1000 ms threshold.
For the device-side integration details, see Metrics with Zephyr.
After the Reboot, Correlate the Three Signals
Once the node reboots, the investigation draws on three sources: the pre-crash log stream, the metrics history for the same time window, and the crash report. Each one answers a different part of the question.
The logs establish the sequence. In this example, CRC mismatch warnings appear first, followed by repeated uplink retries that increase the backlog, a rising sensor_data_age_ms, and finally the parser encountering a frame with channel_count=7. That ordering tells you the input side degraded before the upload side collapsed.
To find the crash report, open the Events page in the Spotflow web app and filter by the device ID and the crash report event type. Spotflow extracts the full call stack from the core dump, register values and local variables for each stack frame, and the state of global variables at the time of the fault. In this example, the call stack traces the path from main() through sensor_node_step() and process_sensor_frame() into decode_auxiliary_channel(), where the parser dereferences a null pointer because it assumes an auxiliary channel exists. The register values confirm the fault address, and the local variable state shows the malformed channel_count value that triggered the path.
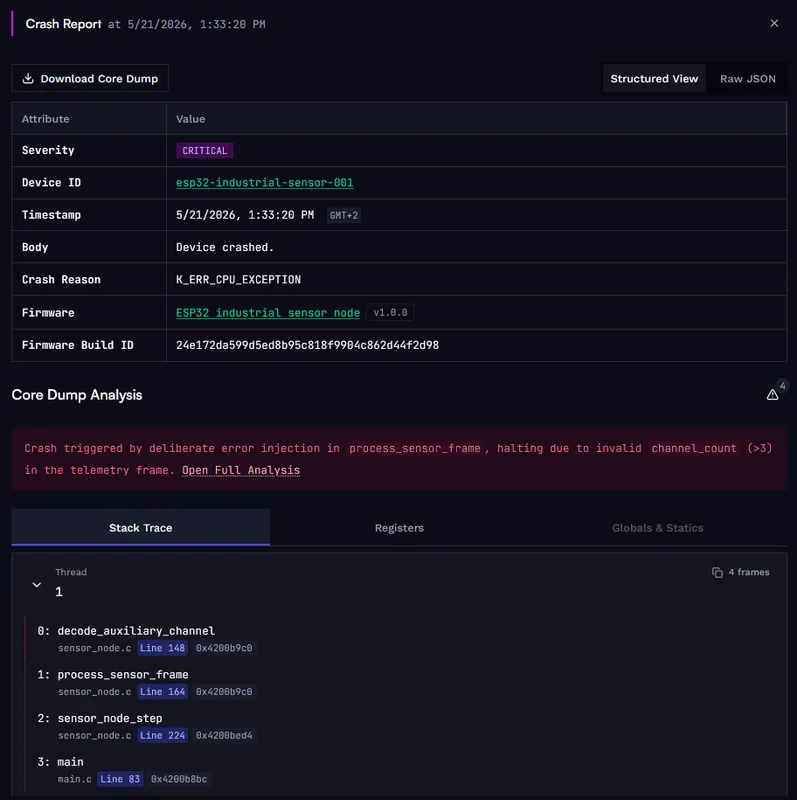
Crash report for the ESP32 sensor node. The stack trace points to decode_auxiliary_channel() as the faulting function and shows the full path back through process_sensor_frame() and sensor_node_step().
With the log sequence, the metric trends, and the crash report together, you have a complete picture of what happened. AI-assisted crash analysis adds a plain-language summary of the fault and correlates the register values and surrounding code to explain why the crash occurred at that address, not just where. In this example, it identifies that channel_count=7 caused the parser to index past the end of a fixed-size auxiliary channel array and pinpoints which register held the null pointer at the moment of the fault. That context goes beyond what the stack trace alone shows. It does not replace the logs or the metrics; it makes the last step of the investigation faster.
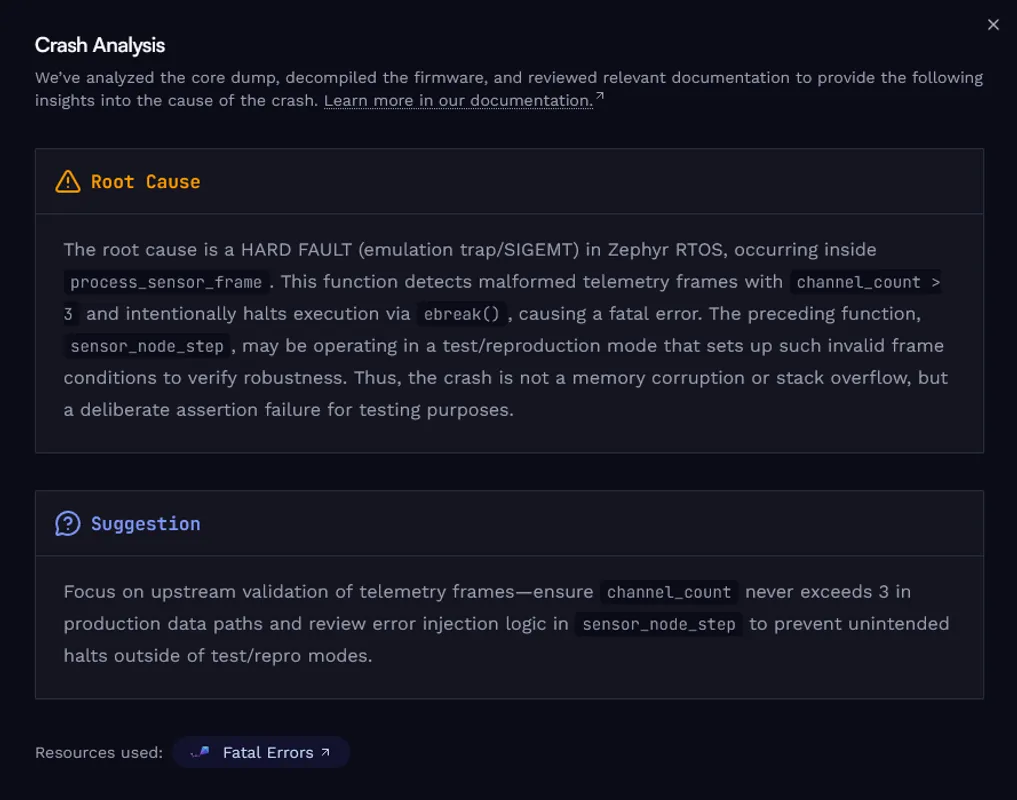
AI-assisted crash analysis for the same report. It provides a plain-language fault summary and correlates register values and code context to explain why the crash occurred at that address, going beyond what the stack trace alone shows.
For the Zephyr-side upload flow, see Crash reports with Zephyr. For the broader product behavior, see Crash reports & core dumps.
The Sample
The complete example used in this post lives in the esp32-industrial-sensor-observability directory of the Spotflow firmware examples repository on GitHub.
It contains the application source and board-specific configs for all supported ESP32 boards, the application metrics and alert thresholds used in this post, and a single setup flow with a board-selection table in the README.
Conclusion
Field debugging is harder than bench debugging because the evidence is often gone by the time you start looking. Logging, metrics, alerts, and crash reports each capture a different layer of that evidence, and each answers a question the others cannot.
Used together as one workflow, they reconstruct what happened. Logs tell you what changed first and whether the cloud session was already established when the failure developed. Metrics show what was degrading before the reboot and make it possible to set threshold rules that fire while the device is still running. When a crash does happen, the crash report provides the call stack, register values, local variables, and global state needed to understand the fault at the code level, and AI-assisted analysis adds a plain-language explanation that ties the register context to the root cause.
The sample shows that workflow end to end on real ESP32 hardware. With this instrumentation in place, a reboot is not the start of the investigation. It is the last event in a sequence that was already visible before it happened.
Ready to get started? Sign up for Spotflow, no credit card required.
Explore the documentation to go deeper:
- Fundamentals: Logging
- Fundamentals: Metrics
- Fundamentals: Alerts
- Fundamentals: Crash reports
- Logging with Zephyr
- Metrics with Zephyr
- Crash reports with Zephyr
- ESP32 Industrial Sensor Observability on GitHub
Questions or feedback? Reach out on Discord or email hello@spotflow.io.