
IoT Device Monitoring in 2026: From Reactive Support to Proactive Fleet Intelligence
A decision framework for teams scaling connected products from first deployment to production fleet.
The number of connected IoT devices reached 21.1 billion globally in 2025 (a 14% year-over-year increase) and is projected to reach 39 billion by 2030.1 Gartner projects that by 2028, 15 billion connected products will have the capacity to act as autonomous market participants, with the business value of those fleets depending entirely on their operational reliability.2 At that volume, the question is no longer whether your devices need monitoring. The question is what to measure, how to structure the effort, and where most teams leave visibility on the table.
The most common pattern: a team ships a product, adds basic uptime alerts, and considers monitoring done. Then field failures arrive as support tickets rather than telemetry. That gap is rarely a tooling problem. It is structural: teams monitor at the wrong level for the failure modes their devices actually exhibit.
This article presents a four-level monitoring maturity model and a decision framework for teams who need to build a monitoring strategy that scales with a growing fleet.
Key Takeaways
- Most production fleets operate at Level 1 (connectivity alerts) while firmware-level failures remain invisible. Level 2 (crash capture, memory metrics, structured logs) is where remote diagnosis becomes viable without physical device access.
- Crash data and OTA outcomes return the highest diagnostic value per byte collected. Core dumps show exactly where the firmware stopped. A rising OTA failure rate in the first hour of a rollout is the signal that lets a team pause at hundreds of devices rather than thousands.
- Device constraints shape monitoring architecture. On-device buffering, CBOR encoding, metric aggregation, and data prioritization are not optional optimizations. They determine whether a monitoring implementation survives a real fleet.
- Build vs. buy is a total cost of ownership question, not a feature comparison. A homegrown stack starts cheap and grows into an internal product to maintain. The EU Cyber Resilience Act adds a regulatory obligation to sustain active monitoring and OTA capability across a product’s supported lifetime.
- Observability and OTA form one loop. Detecting a field problem without a remote path to fix it is only half a solution.
Why Inadequate IoT Device Monitoring Is a Business Risk
Monitoring is often framed as a quality concern. The financial exposure is more direct.
Siemens’ True Cost of Downtime 2024 report puts the hourly cost of an outage between $40,000 in consumer goods and over $2 million in automotive manufacturing.3 Global enterprise IoT spending reached approximately $298 billion in 2024, growing 10% year-over-year, which reflects the scale of the asset base where undiagnosed failures accumulate.4 For deployed IoT fleets, this translates to device failures that either escalate into customer incidents or require field interventions that cannot be resolved remotely.
The returns problem compounds this. Research from Accenture estimates that approximately two-thirds of consumer electronics returns are classified as “no fault found”: the device is returned, but no hardware defect is reproduced in testing.5 The underlying cause, if there was one, remains undiagnosed in the field. Each no-fault return carries hardware, logistics, and support costs in addition to the lost customer relationship.
A third cost is less visible: engineers attempting to reproduce field failures in a lab that does not match deployment conditions. That time is not spent on product capabilities.
The pattern in all three cases is the same: the cost is not visible until it has already been incurred. Structured monitoring converts a future support escalation into a data point that can be acted on earlier in the failure lifecycle.
The IoT Monitoring Maturity Model
Most teams do not fail to monitor; they monitor at the wrong level for the failure modes their fleet actually exhibits. The following four-level model serves as a self-assessment tool and investment roadmap.
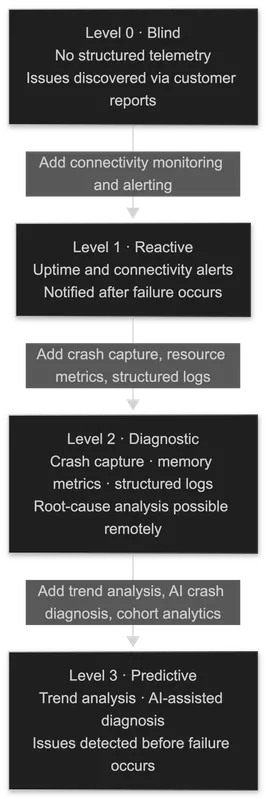
Level 0: Blind. No structured telemetry from deployed devices. Issue discovery depends entirely on customer reports. The engineering response starts with no device-side data and typically ends with a firmware engineer spending days attempting a bench reproduction.
Level 1: Reactive. The team monitors whether devices are online and receives alerts when connectivity drops. This is the most common level in production fleets: it covers the most visible failure mode but leaves the majority of firmware-level failures undetected until they surface as customer complaints. Most teams stop here because uptime monitoring feels sufficient until a real field incident occurs.
Level 2: Diagnostic. The team captures crash data, core dumps, memory metrics, and structured logs from field devices. When a failure occurs, engineers can investigate from the data the device already reported, without physical access or bench reproduction. This is when remote debugging becomes operationally viable.
Level 3: Predictive. The team uses trend data and automated analysis to detect degradation before it causes a failure. Heap fragmentation growing over weeks, rising reconnect rates tied to a firmware version, OTA failures correlated with a hardware batch: each becomes detectable before the downstream failure event. AI-assisted crash analysis, such as Spotflow’s automated crash diagnosis, reduces triage time at this level by automatically extracting root-cause insights from each core dump.
Self-assessment: How was your last field issue first reported? If the answer is “a customer,” you are operating at Level 0 or 1. If the answer is “an alert we configured,” you are at Level 1 or 2. If the answer is “a trend we detected before any customer noticed,” you are at Level 3.
Reaching Level 2 is achievable with focused investment and does not require large-scale platform changes. Moving to Level 3 requires fleet-level analytics and automated analysis, which are difficult to maintain in-house without significant ongoing engineering cost.
Signals That Drive Fleet Decisions
Not all telemetry is equally valuable. Collecting everything is impractical at device scale: it consumes RAM, bandwidth, and battery. These five signal categories justify their overhead because they map directly to the failure modes most costly to diagnose without them.
Crash data and core dumps. A field crash captured as a core dump (containing register values, stack traces, and the event sequence leading to the fault) provides more diagnostic value than any bench reproduction. Spotflow’s crash reports documentation describes how AI-assisted analysis can automatically extract a root-cause explanation and suggested fix from each dump, typically within seconds of the report arriving.
Memory health trends. Heap fragmentation, stack high-water marks, and memory leak indicators rarely show symptoms until they trigger a reset. They accumulate over days or weeks, and trend data across the fleet makes them identifiable as a growing pattern, enabling a fix before the reset cascade begins.
Connectivity metrics. Reconnect rate, signal quality, and disconnection frequency represent the largest source of IoT support volume in most product categories. These metrics are strongly environment-dependent: they reflect the user’s RF environment, network conditions, and device placement in ways that a lab cannot replicate. Fleet-level data is the only reliable way to distinguish firmware-caused connection issues from environment-caused ones.
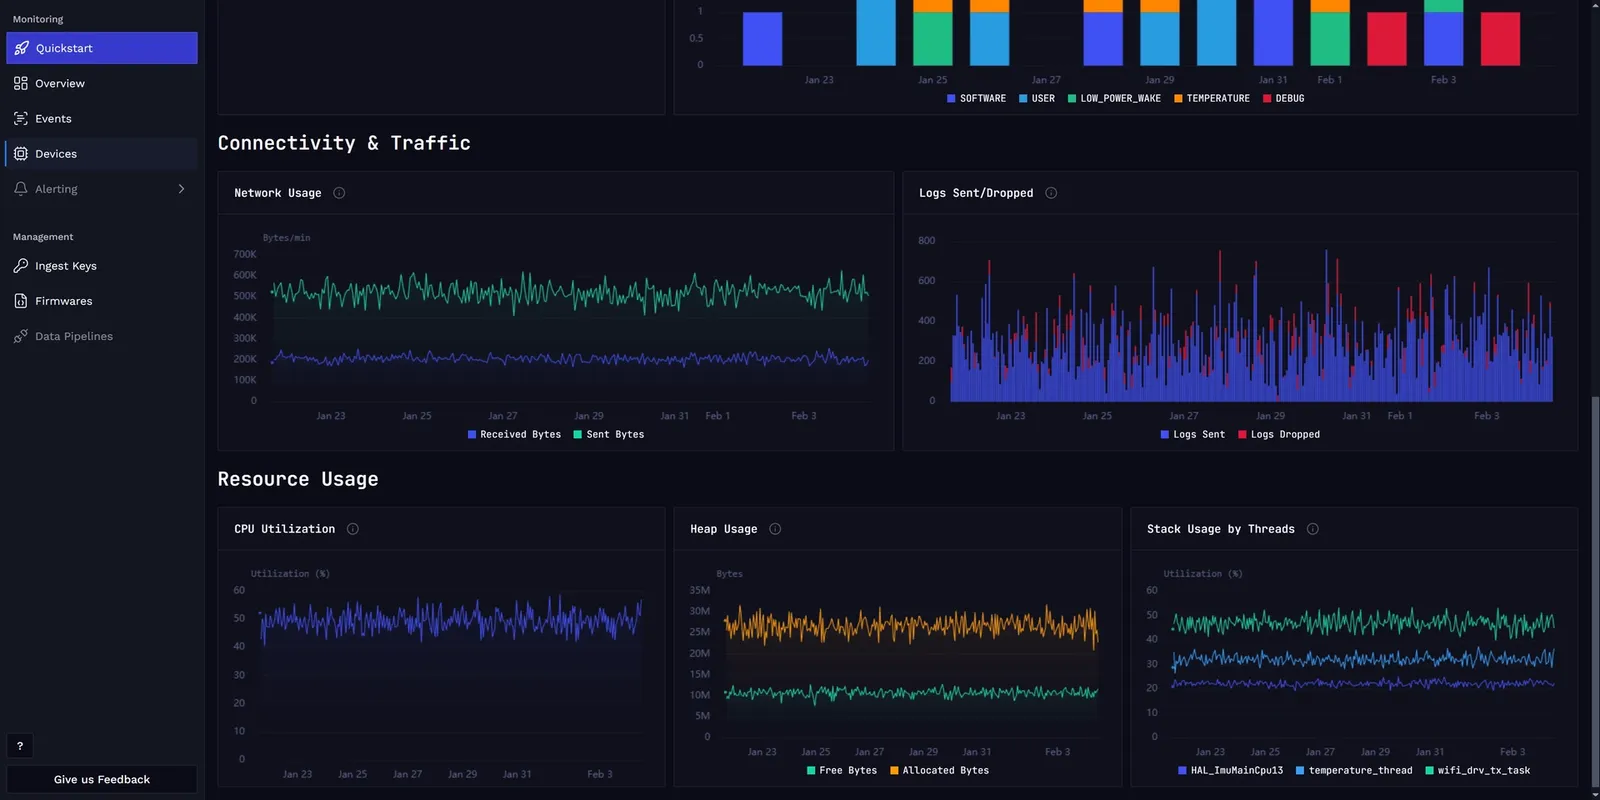
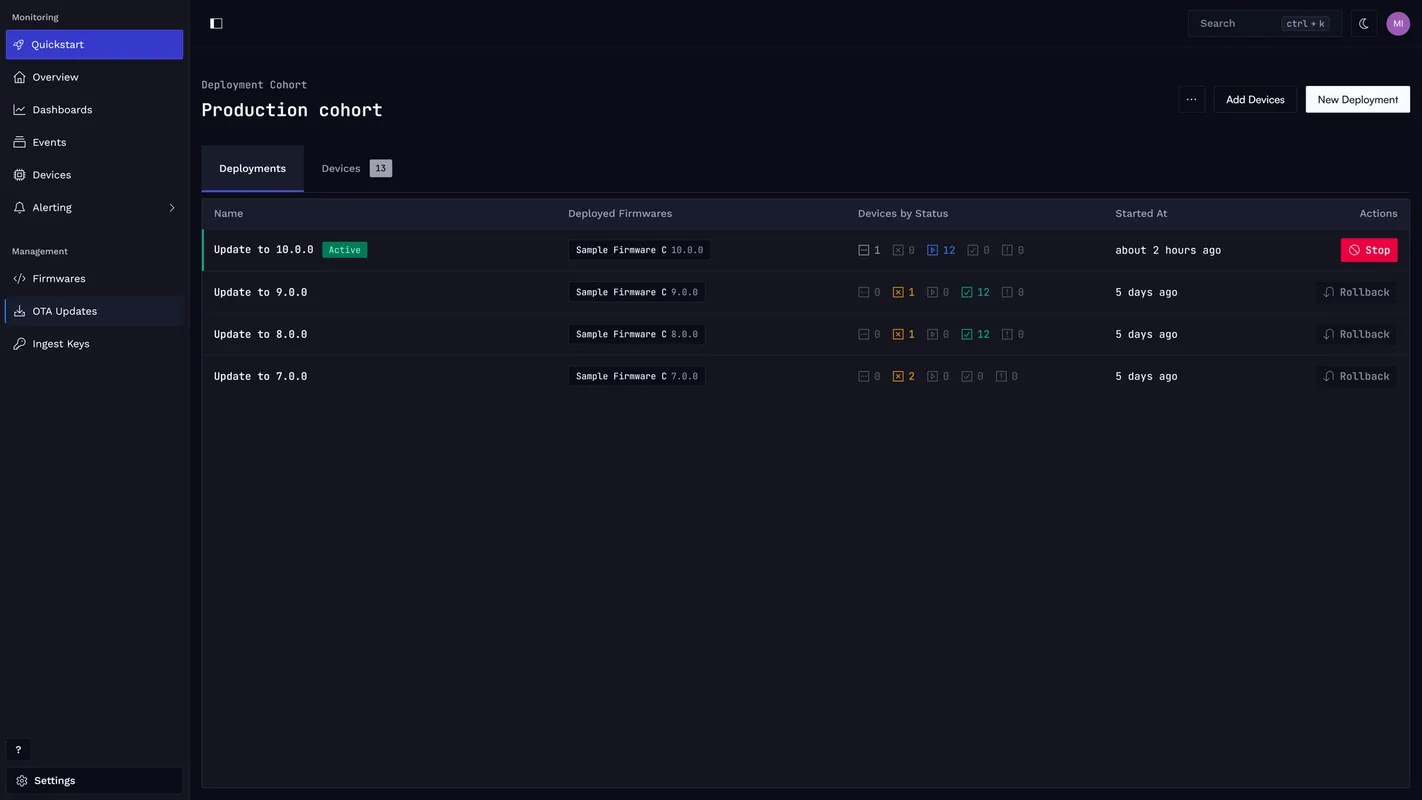
OTA outcomes. Update success, failure, and rollback rates per firmware version and cohort form a feedback loop with release decisions. A rising failure rate in the first hour of a staged rollout lets a team pause at a few hundred devices rather than rolling back tens of thousands. Spotflow’s OTA documentation describes the per-device states tracked throughout each deployment (pending, in progress, succeeded, failed, cancelled) that enable this kind of early-stage detection.
Security and integrity signals. Firmware image verification failures and anti-rollback events indicate either a compromised update path or a botched OTA delivery. They are security indicators and reliability signals simultaneously. The NIST Cybersecurity Framework 2.0 identifies continuous monitoring as a core component of its Detect function, applicable across technology environments including deployed IoT devices.6
Engineering Monitoring Around Device Constraints
Embedded devices cannot behave like cloud services. They operate with constrained RAM, intermittent connectivity, limited flash storage, and power budgets that directly affect operational cost. A monitoring approach that does not account for these constraints will be reduced or eliminated under operational pressure.
Four design principles determine whether a monitoring implementation survives contact with a real fleet:
On-device buffering. Telemetry collected while a device is offline must persist until the next connection. A RAM queue drains automatically on reconnect. Core dumps additionally survive reboots by being written to a dedicated flash partition before upload. Spotflow’s resource-constrained device guide documents tunable queue parameters, such as SPOTFLOW_LOG_BACKEND_QUEUE_SIZE, for fitting the buffer to available memory on specific hardware.
Efficient encoding. Binary serialization reduces over-the-air payload substantially. CBOR uses integer keys instead of repeated string field names, and encodes numeric values in their native binary form rather than as ASCII digits. For a typical structured log message (timestamp, severity level, module name, and a short body), CBOR produces payloads roughly 30–50% smaller than equivalent JSON, with the gap widening as message volume scales. That difference compounds across thousands of messages per day on cellular-constrained devices, directly affecting data plan cost and radio-on time.
Metrics aggregation. On-device aggregation collects samples locally at high frequency but transmits a single message containing sum, count, min, and max per window. At a one-hour aggregation interval, a metric sampled every 10 seconds produces one MQTT transmission instead of 360, a 99.7% reduction in radio transactions for that signal.
Data prioritization. Crash data is transmitted before metrics; metrics before verbose logs. When bandwidth or battery is the binding constraint, this ordering ensures the highest-value signals reach the platform regardless of connection window length.
Build vs. Buy: A Total Cost of Ownership Perspective
The build-vs-buy decision for IoT monitoring is primarily a total cost of ownership question, not a feature comparison.
A homegrown monitoring stack has predictably low initial cost and high ongoing cost. The initial implementation takes weeks. The ongoing cost is less predictable: keeping it current as the fleet scales, security requirements evolve, and firmware versions fragment means the internal tool tends to drift toward minimum viable rather than expanding with operational needs.
The EU Cyber Resilience Act (Regulation EU 2024/2847), published in the Official Journal of the European Union in October 2024 and in force since November 2024, introduces an additional factor.7 It requires manufacturers to handle known vulnerabilities and provide security updates across a product’s support period. That obligation is operationally difficult to meet without a functional detection capability (monitoring) and a reliable update path (OTA).8 An unmaintained internal monitoring stack adds regulatory risk in addition to operational risk.
The case for a purpose-built platform is strongest when reliability is a product differentiator, the fleet is growing faster than the team’s capacity to maintain internal tooling, or OTA and monitoring must function as a coupled loop. For a structured comparison of approaches (homegrown, generic APM, and purpose-built platforms), see the Guide to Firmware Observability in 2026.
Platform Selection: Five Operational Questions
These five questions align platform selection with the operational outcomes that matter at fleet scale:
- Can it capture and symbolicate full core dumps automatically? Raw crash addresses are not actionable. Symbolicated stack traces mapped to source code lines, along with AI-generated root-cause analysis, are.
- Does it respect device constraints by design? Binary transport protocols, configurable on-device buffers, and documented RAM and bandwidth overhead indicate a platform built for embedded hardware rather than adapted from cloud APM.
- Does it provide fleet-level views and cohort analytics? Per-device data surfaces individual incidents. Fleet-level trend data segmented by firmware version, hardware revision, or deployment region is where the actionable patterns appear.
- Is OTA tightly integrated with telemetry feedback? The observe-update-verify loop only closes when both halves are in the same system.
- What is the time to first real crash report? Platforms that require weeks of integration before returning diagnostic value increase the risk that the evaluation loses organizational support before it demonstrates results.
FAQs
What is IoT device monitoring? IoT device monitoring is the practice of collecting, transmitting, and analyzing telemetry from deployed embedded devices (including crash reports, resource metrics, connectivity data, and firmware update outcomes) so that engineering teams can detect and investigate failures without physical access to the device.
What is the IoT Monitoring Maturity Model? It is a four-level framework for assessing field visibility. Level 0 (Blind): issues arrive via customer reports with no telemetry. Level 1 (Reactive): uptime and connectivity alerts. Level 2 (Diagnostic): crash capture, memory metrics, and structured logs, enabling remote root-cause analysis. Level 3 (Predictive): trend analysis and AI-assisted diagnosis, detecting issues before failure. Most production teams operate at Level 1; reaching Level 2 is achievable with focused investment.
At what fleet size should we invest in a purpose-built monitoring platform? Fleet size is less relevant than the cost of failure. A fleet of 500 devices in a safety-critical application justifies more investment than a fleet of 50,000 devices with low reliability stakes. The practical trigger is when on-call support load or engineering forensics time becomes a significant fraction of team capacity.
Are there any off-the-shelf solutions for fleet observability? Yes. The main categories are homegrown stacks (viable early, high ongoing maintenance), generic APM tools adapted from cloud services (poor fit for MCU constraints), and purpose-built embedded observability platforms. Within the purpose-built category, platforms differ on price, supported RTOSes, and integration depth. For a structured comparison of all four approaches, see the Build, adapt, or adopt section of the Guide to Firmware Observability in 2026.
How do we monitor IoT devices that connect intermittently or over low-bandwidth links? On-device buffering stores telemetry locally during disconnection and transmits it on reconnect. Metrics aggregation reduces transmission frequency without losing data fidelity. Data prioritization ensures crash data reaches the platform even when the connection window is short. Together, these make structured monitoring viable on NB-IoT, LTE-M, or constrained Wi-Fi without requiring persistent connectivity.
What does the EU Cyber Resilience Act require for IoT device monitoring? The CRA (Regulation EU 2024/2847) does not specify a monitoring tool, but it requires manufacturers to handle known vulnerabilities and provide security updates throughout a product’s supported lifetime. Meeting that obligation requires the ability to detect issues in the field (monitoring) and a reliable path to deploy fixes (OTA). Teams that treat monitoring and OTA as the technical foundation for CRA compliance are in a better operational position.
How does AI-assisted crash analysis work for embedded devices? When a device crashes, the firmware writes a core dump to flash: a binary snapshot of processor state, stack memory, and thread data at the point of failure. A platform with AI crash analysis uploads this binary, links it to the ELF debug symbols for the matching firmware build, extracts the stack trace, register values, and global variable state, then identifies the root cause. The output is a human-readable explanation and suggested fix, typically available within seconds. Spotflow’s implementation, including how build IDs match core dumps to the correct symbol files, is described in the crash reports documentation.
Citations
Footnotes
Satyajit Sinha, “State of IoT 2025: Number of connected IoT devices growing 14% to 21.1 billion globally,” IoT Analytics, October 2025. https://iot-analytics.com/number-connected-iot-devices/ ↩
Gartner, Inc., “Gartner Identifies the Top 10 Strategic Technology Trends for 2024,” press release, October 16, 2023. https://www.gartner.com/en/newsroom/press-releases/2023-10-16-gartner-identifies-the-top-10-strategic-technology-trends-for-2024 ↩
Siemens AG, “The True Cost of Downtime 2024.” https://assets.new.siemens.com/siemens/assets/api/uuid:1b43afb5-2d07-47f7-9eb7-893fe7d0bc59/TCOD-2024_original.pdf ↩
Cole Christian, “IoT 2024 in review: The 10 most relevant IoT developments of the year,” IoT Analytics, January 15, 2025. https://iot-analytics.com/iot-2024-review/ ↩
Accenture, consumer electronics returns analysis, as cited in Spotflow, “The Guide to Firmware Observability in 2026,” June 2026. https://spotflow.io/blog/guide-to-firmware-observability-2026 ↩
National Institute of Standards and Technology, “The NIST Cybersecurity Framework 2.0,” NIST Cybersecurity White Paper CSWP 29, February 26, 2024. https://nvlpubs.nist.gov/nistpubs/CSWP/NIST.CSWP.29.pdf ↩
European Parliament and Council of the European Union, Regulation (EU) 2024/2847 on Horizontal Cybersecurity Requirements for Products with Digital Elements (Cyber Resilience Act), Official Journal of the European Union, October 23, 2024. https://eur-lex.europa.eu/legal-content/EN/TXT/?uri=OJ:L_202402847 ↩
Stephanie Domas, “What The Cyber Resilience Act Means For IoT Manufacturers,” Forbes Technology Council, October 21, 2024. https://www.forbes.com/councils/forbestechcouncil/2024/10/21/what-the-cyber-resilience-act-means-for-iot-manufacturers/ ↩