
On your desk, a Zephyr RTOS device is fully observable: a serial cable gives you LOG_INF() output in real time, and a debugger gives you registers and a stack trace the moment something crashes. Ship that same device to a customer site, a vehicle, or a basement utility closet, and both of those disappear. The firmware still fails the same way. You just cannot see it happen anymore.
This post covers three layers of the same problem. First, what “observability” actually means for firmware and why it stops being optional once devices leave the bench. Second, exactly how Zephyr’s built-in logging subsystem and core dump service work, including their real limits in a production fleet. Third, how Spotflow extends those same native Zephyr subsystems, without touching your application code, to get logs, crash dumps, and firmware metadata off the device and into a place where you can query them. Concrete, runnable code lives in the firmware-observability-examples repository and is referenced throughout rather than repeated.
Key Takeaways
- Zephyr already gives you most of the raw material. The logging subsystem and core dump service capture everything you need, they just were not designed to get that data off a device with no one standing next to it.
- The default fatal-error behavior is to halt, not reboot. Left unmodified, a Zephyr device that crashes in the field sits there until someone power-cycles it. This is the single most important production gotcha in this post.
- Spotflow adds the missing transport, it does not replace Zephyr’s subsystems. It plugs into Zephyr’s existing logging backend chain and core dump subsystem as a west module. Your
LOG_INF()calls and fatal-error path stay exactly the same. - Firmware metadata is what makes fleet-wide debugging possible. A build ID embedded in the ELF and reported by every device is what lets you link a specific crash or log line back to the exact firmware version that produced it.
- Everything here maps to runnable examples. zephyr-crash-debugging, smart-lock-fleet, and esp32-industrial-sensor-observability are complete, buildable Zephyr projects.
Embedded Observability Fundamentals
What Observability Means for Firmware
“Observability” originally describes a property of a system, not a set of tools: how well you can infer a system’s internal state from the outputs it already produces, without having to ship new code to ask a new question. In cloud engineering this discipline is well established around the pillars of logs, metrics, and traces (see Observability Engineering by Charity Majors, Liz Fong-Jones, and George Miranda, O’Reilly, 2022). Applied to firmware, the same idea holds: can you understand why a specific device did what it did, using only the data it already reported, days or weeks after the fact?
This is a different question from monitoring. Monitoring tells you that something is wrong: a device stopped checking in, a metric crossed a threshold, a reset counter incremented. Observability lets you ask why, after the event, from data the device already sent, without having known in advance which question you would need to ask. A fleet dashboard that is all green tells you monitoring is working. It says nothing about whether you could explain the next field failure if it happened right now.
Why It Matters Once Devices Leave the Bench
A handful of constraints make firmware observability structurally different from server-side observability, and each one gets worse, not better, in production:
- No physical access. A JTAG probe and a serial terminal are the default embedded debugging toolkit, and both require someone standing next to the hardware. Many production devices do not even expose those ports: JTAG headers are often left unpopulated to cut cost, and USB is frequently omitted for security or bill-of-materials reasons. A device installed in a customer’s building, a vehicle, or a remote industrial site is, for practical purposes, unreachable.
- Intermittent connectivity. Even connected devices are not always connected. Wi-Fi drops, cellular coverage is patchy, gateways reboot. Any telemetry pipeline that assumes a permanent link will silently lose exactly the data generated during the outage, which is often the most interesting data.
- Constrained resources. Flash, RAM, and radio airtime are all budgeted. You cannot log everything at debug verbosity forever and transmit it uncompressed; every design decision here is a trade-off between visibility and footprint.
- Failures that never reproduce on a bench. The hardest field bugs are field-only by definition: a specific RF environment, a rare interleaving of interrupts, a brownout at a particular voltage, a memory leak that only crosses its threshold after three weeks of uptime. No amount of desk testing recreates these reliably.
This is increasingly not only an engineering concern. In the EU, the Cyber Resilience Act (Regulation (EU) 2024/2847, in force since 10 December 2024) sets expectations for manufacturers to handle vulnerabilities and ship security updates across a product’s lifetime. No regulation mandates a specific tool, but meeting that obligation is far easier when you already have visibility into what a deployed fleet is doing.
The Building Blocks: Logs, Metrics, Events, Crash Reports, and Firmware Metadata
Firmware observability is built from five kinds of data. Keeping them distinct matters, because each has a different cost, a different transport, and a different downstream use:
- Logs are a timestamped, human-readable narrative at a given severity (
DEBUG/INFO/WARNING/ERROR) — what the firmware was doing, in order, leading up to a moment of interest. - Metrics are numeric time series: heap free bytes, CPU utilization, a sensor reading, an operation duration. They are cheap to aggregate and good at showing trends and degradation over time.
- Events are discrete occurrences, not continuous measurements: a door was opened, an OTA update completed, a reconnect happened. An event is a metric with no aggregation window, reported the instant it occurs.
- Crash reports and core dumps capture the full CPU register and memory state at the moment of a fatal fault. This is the highest-value signal you can collect, because it is the closest thing to attaching a debugger after the fact.
- Firmware metadata identifies exactly which build produced a given signal: firmware name, version, and a build identifier tied to the exact binary and its debug symbols. Without this, a log line or crash from a mixed fleet running a dozen firmware versions is much harder to interpret.
Zephyr has strong native support for logs and crash reports/core dumps. The rest of this post covers exactly how, where the native tooling stops, and how Spotflow extends the same subsystems to complete the picture.
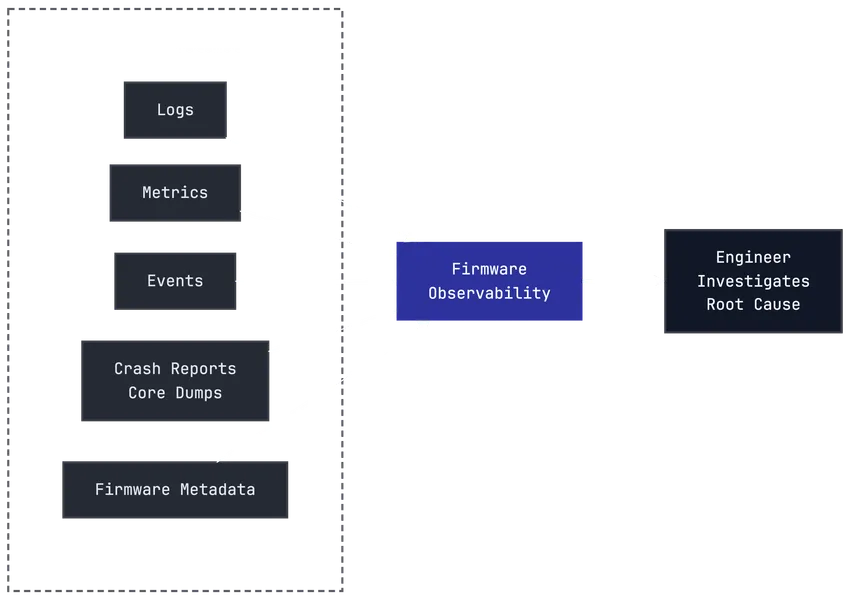 Embedded observability pipeline showing logs, metrics, events, crash reports and core dumps, and firmware metadata flowing into firmware observability, which then supports root-cause analysis by the engineer.
Zephyr’s Built-In Observability Features
The Zephyr Logging Subsystem
Zephyr’s logging subsystem is built from three parts: a frontend that captures a log call as cheaply as possible (it can be called safely from an ISR), a core that stores the message in a circular packet buffer, and one or more backends that format and output it. Up to nine backends can be active at once, each with independent runtime filtering.
Every module registers itself once and uses the standard macros for each of the four severity levels:
#include <zephyr/logging/log.h>

LOG_MODULE_REGISTER(sensor_node, CONFIG_SENSOR_NODE_LOG_LEVEL);

static void check_threshold(float temp_celsius, float threshold)
{
    LOG_INF("Sensor reading: %d.%d C", (int)temp_celsius,
            (int)(temp_celsius * 10) % 10);

    if (temp_celsius > threshold) {
        LOG_WRN("Temperature threshold exceeded: %d.%d C (threshold: %d.%d C)",
                (int)temp_celsius, (int)(temp_celsius * 10) % 10,
                (int)threshold, (int)(threshold * 10) % 10);
    }
}
A handful of Kconfig choices determine how much this costs at runtime:
CONFIG_LOG=y
CONFIG_LOG_MODE_DEFERRED=y      # format on a dedicated thread, not at the call site
CONFIG_LOG_BUFFER_SIZE=4096     # circular packet buffer size in bytes
CONFIG_LOG_DEFAULT_LEVEL=3      # INFO for modules that do not set their own level
CONFIG_LOG_MODE_OVERFLOW=y      # drop oldest buffered messages instead of the newest
CONFIG_LOG_MODE_DEFERRED is the default and the one you want in almost every case: the call site only allocates a message and copies its arguments, and the relatively expensive string formatting happens later on a dedicated logging thread. CONFIG_LOG_MODE_IMMEDIATE formats and outputs synchronously at the call site, which is simpler to reason about but more expensive per call. Log calls can still be made from interrupt context in this mode, but the message is formatted and passed to the backend synchronously inside the ISR, which can greatly increase interrupt latency and is only safe when the selected backend and its transport are ISR-safe and non-blocking. CONFIG_LOG_MODE_MINIMAL strips the subsystem down to a printk-based implementation for the tightest flash budgets.
Filtering happens at two points. At compile time, a module’s LOG_LEVEL (or the global CONFIG_LOG_MAX_LEVEL) decides whether a call is compiled in at all. At runtime, if CONFIG_LOG_RUNTIME_FILTERING is enabled, each backend can independently raise or lower its own severity threshold per module without a rebuild. This is what makes it possible to run a device at INFO in steady state and turn on DEBUG for a single module while investigating an issue.
Two more details are worth knowing before you rely on this in production. First, when the system enters log_panic() (called automatically from Zephyr’s fatal-error path), deferred processing stops and every subsequent log call is flushed synchronously and immediately. This is why the last few warnings before a crash reliably make it out to a backend even though the system is about to go down. Second, Zephyr recently added rate-limited logging macros (LOG_WRN_RATELIMIT, LOG_ERR_RATELIMIT, and friends), which cap how often a specific call site can emit a message. This matters directly for field devices: a connectivity flap that would otherwise flood the log buffer with the same warning hundreds of times per second is exactly the scenario these macros exist for.
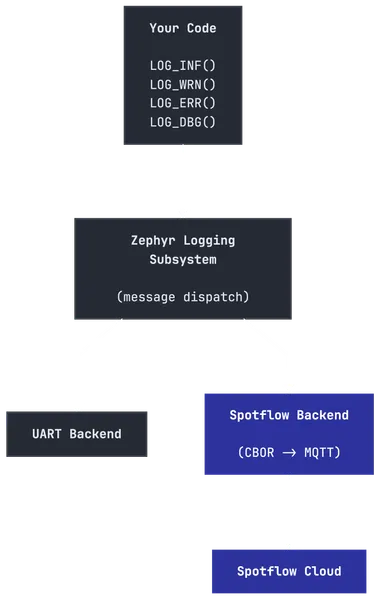 Spotflow as a backend in the Zephyr logging subsystem: application log calls flow through Zephyr's logging core to both the UART backend and the Spotflow backend simultaneously.
Zephyr Core Dumps
When a fatal error occurs, Zephyr’s core dump module captures CPU registers and memory content and writes them out through whichever backend is enabled: DEBUG_COREDUMP_BACKEND_LOGGING (prints to a log backend as a hex-encoded stream), DEBUG_COREDUMP_BACKEND_LOGGING_UDP (the same, plus optional raw UDP transfer to a receiver script), or DEBUG_COREDUMP_BACKEND_FLASH_PARTITION (writes to a dedicated flash region so the data survives a reboot).
How much memory gets captured is a separate, independent choice:
CONFIG_DEBUG_COREDUMP=y
CONFIG_DEBUG_COREDUMP_BACKEND_FLASH_PARTITION=y

# Choose one memory dump mode:
CONFIG_DEBUG_COREDUMP_MEMORY_DUMP_LINKER_RAM=y   # default: full static RAM image
# CONFIG_DEBUG_COREDUMP_MEMORY_DUMP_THREADS=y    # struct + stack of every thread
# CONFIG_DEBUG_COREDUMP_MEMORY_DUMP_MIN=y        # only the faulting thread's stack

CONFIG_DEBUG_COREDUMP_THREADS_METADATA=y         # named threads, stack boundaries
Zephyr provides three choices regarding memory dump:
CONFIG_DEBUG_COREDUMP_MEMORY_DUMP_LINKER_RAM=ydumps the full statically allocated RAM image: global variables, static variables, and all data and BSS sections. This is the Zephyr default.CONFIG_DEBUG_COREDUMP_MEMORY_DUMP_THREADS=ycaptures the struct and stack of every running thread, plus all data the debugger needs to walk those stacks. Choose this when you need reliable stack inspection across all threads, not just the one that faulted, but capturing the full static RAM image (LINKER_RAMabove) would produce more data than you can reasonably store or transmit.CONFIG_DEBUG_COREDUMP_MEMORY_DUMP_MIN=ycaptures only the faulting thread and the bare minimum data to support stack walking. Use this only when flash space is severely constrained.
CONFIG_DEBUG_COREDUMP_THREADS_METADATA=y adds a thread metadata block to the dump, enabling thread-aware analysis with named threads and stack boundaries. It is independent of the memory dump mode and can be combined with any of them.
The resulting binary file uses Zephyr’s own core dump format, not the ELF-based core file that Linux produces, and has a fixed structure: a file header (target architecture, pointer size, fatal-error reason), an architecture-specific block (register values), an optional threads-metadata block, and one or more memory blocks (start address, end address, raw bytes). Whichever backend you enable, the raw dump has this same structure; the backend only changes how you retrieve it. The example below uses the serial-console (logging) backend, the simplest to reproduce on the bench and the one Zephyr documents, then hands the dump to Zephyr’s own GDB stub scripts, which turn it into something a standard GDB can attach to:
# Convert a serial-console core dump log into Zephyr's binary format
./scripts/coredump/coredump_serial_log_parser.py coredump.log coredump.bin

# Start a GDB server backed by the binary dump and the matching ELF
./scripts/coredump/coredump_gdbserver.py build/zephyr/zephyr.elf coredump.bin

# In a separate terminal, attach GDB as usual
<sdk>/gdb build/zephyr/zephyr.elf
(gdb) target remote localhost:1234
(gdb) bt
(gdb) info registers
This is a real, working debugger session reconstructed entirely from a fault that already happened, exactly as documented in Zephyr’s own core dump example.
One default behavior deserves particular attention before you rely on any of this in the field: Zephyr halts the system unconditionally after a fatal error (typically by entering an infinite loop, architecture-dependent) rather than rebooting. That is a reasonable default for bench debugging, where a halted board is exactly what you want so a probe can attach. It is the wrong behavior for a deployed device, where a halted board is a device that is now offline until someone physically power-cycles it. Production firmware needs a custom k_sys_fatal_error_handler() that reboots after the core dump is safely written to flash.
Strengths and Limits of Zephyr’s Native Tooling in Production
What Zephyr gives you out of the box is genuinely strong: no vendor lock-in, a fully offline workflow via GDB, a backend model flexible enough to fit almost any flash and bandwidth budget, and deep kernel integration that gives you accurate thread and stack data without any external instrumentation.
What it does not give you is a way to get any of this data off a device that nobody is standing next to:
- The default serial (logging) backend prints the dump to a console that someone has to be watching at the moment of the crash, and the
LOGGING_UDPbackend requires a person (or a script) runningcoredump_udp_receiver.pyat a known, reachable address at that same moment. There is no concept of a durable, authenticated, internet-reachable ingestion endpoint. DEBUG_COREDUMP_BACKEND_FLASH_PARTITIONreliably preserves a crash across a reboot, but the dump then sits on flash until something retrieves it. Nothing in the subsystem defines how, or whether, that retrieval happens automatically.- The default fatal-error handler halts rather than reboots, so without custom code a crashed field device stays down.
- There is no built-in fleet view: no way to see that the same crash signature occurred on 40 devices running firmware v2.3.0 and zero devices running v2.3.1, no automatic symbolication tied to the exact build that produced a given dump, and no deduplication across thousands of reports of the same bug.
None of this is a shortcoming in Zephyr’s design. Logging and core dumps are OS-level primitives, correctly scoped to a single device and a single debugging session. Turning them into fleet-wide, remote, production observability is a separate, additive layer, which is exactly what the rest of this post covers.
Extending Zephyr with Spotflow for Remote Diagnostics
How Spotflow Plugs into Zephyr’s Native Subsystems
Spotflow ships as a standard west module that you add as a dependency, the same mechanism Zephyr already uses for every other external component. It does not patch the kernel and does not require a separate logging or crash-reporting API in your application code. Instead, it attaches to the extension points Zephyr already exposes:
- It registers as an additional logging backend, so your existing
LOG_INF()/LOG_WRN()/LOG_ERR()/LOG_DBG()calls are captured by Zephyr’s logging core exactly as before, then forwarded to Spotflow’s backend alongside whatever backend (typically UART) you already have. - It enables
DEBUG_COREDUMP_BACKEND_FLASH_PARTITIONand provides a customk_sys_fatal_error_handler()implementation, so a fatal fault writes the core dump to flash and then reboots the device, instead of halting it. - On the next boot, it detects the pending core dump in the flash partition and uploads it in the background during normal operation, so device startup is never blocked waiting on the upload.
- It embeds a build ID into the ELF as a Zephyr Binary Descriptor (ID
0x5f0, GNU-build-ID-style, computed from the code and data sections that affect runtime behavior), so every log line and crash report can be linked back to the exact firmware version and its debug symbols.
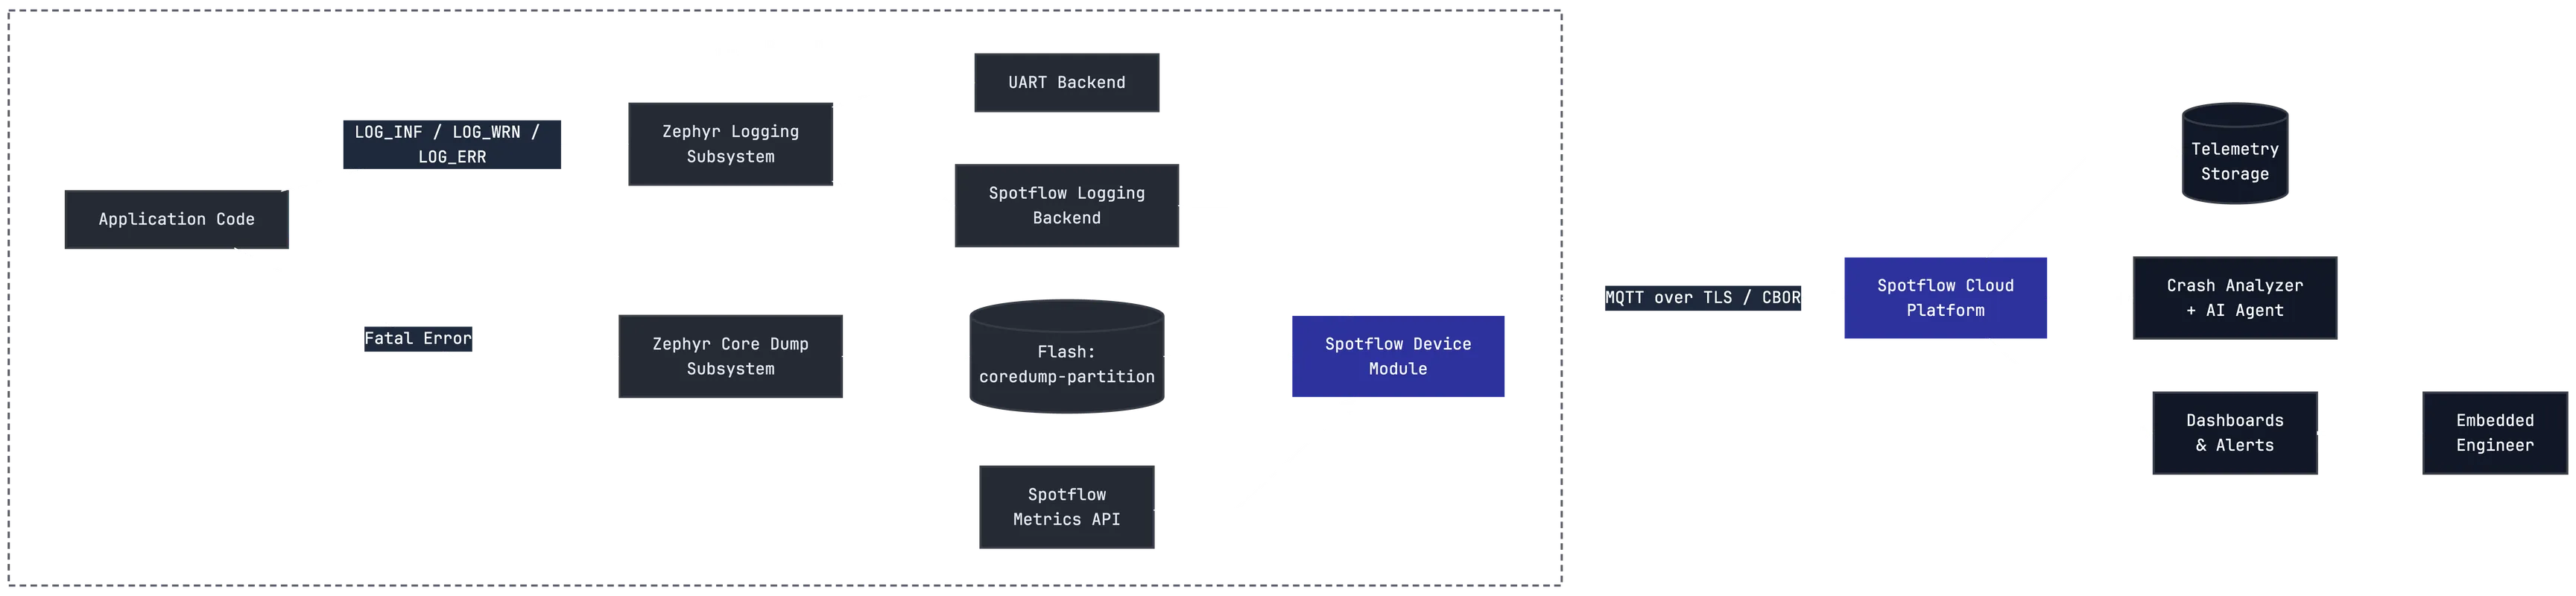
The smallest set of Kconfig options to enable both logging and crash collection together (see Logging with Zephyr and Crash reports with Zephyr for the full reference):
# prj.conf
CONFIG_SPOTFLOW=y
CONFIG_SPOTFLOW_DEVICE_ID="zephyr-device-001"
CONFIG_SPOTFLOW_INGEST_KEY="{your-ingest-key}"

# Core dump collection
CONFIG_SPOTFLOW_COREDUMPS=y
CONFIG_DEBUG_COREDUMP_MEMORY_DUMP_LINKER_RAM=y
CONFIG_DEBUG_COREDUMP_THREADS_METADATA=y
/* boards/<your_board>.overlay */
&flash0 {
partitions {
coredump_partition: partition@f0000 {
label = "coredump-partition";
reg = <0x000f0000 DT_SIZE_K(64)>;
};
};
};The coredump-partition label is required by name; Zephyr’s flash-backed core dump backend looks it up specifically. Partition size depends on the memory dump mode you chose: a full LINKER_RAM dump needs headroom close to your device’s usable RAM, MIN needs only enough room for the faulting thread’s stack, and THREADS falls in between and scales with how many threads you run and how large their stacks are, so size it against your own thread count rather than a fixed number. The zephyr-crash-debugging example works through this sizing decision concretely on an NXP FRDM-RW612.
Securely Collecting Logs, Crash Dumps, and Firmware Metadata from the Field
All transport, for both logs and core dumps, uses MQTT over TLS 1.2+, authenticated with an ingest key as the MQTT password and the device ID as the MQTT username, trusted against the Let’s Encrypt ISRG Root X1 certificate. Payloads are encoded in CBOR for bandwidth efficiency (a JSON schema is also available for custom MQTT integrations on non-Zephyr platforms). If the network is unavailable, entries buffer in a circular queue on-device; when connectivity returns, buffered data sends automatically, with the oldest entries dropped first if the buffer fills. Once a message is accepted by Spotflow’s cloud broker, delivery to storage is guaranteed; only messages lost before that point (governed by the MQTT QoS level used) are not covered.
For logs, this means the same LOG_INF()/LOG_WRN()/LOG_ERR() calls you already write are what Spotflow captures. Nothing application-specific is required, and UART output is unaffected: both backends run side by side. One capability this adds beyond what Zephyr provides natively is remote reconfiguration: you can raise or lower a specific device’s minimum log severity from the Spotflow web application without reflashing, which is the practical way to turn on verbose logging for one misbehaving unit in a fleet of thousands without a bandwidth hit on the rest.
For crash dumps, the sequence is exactly the one described in the previous section, made concrete:
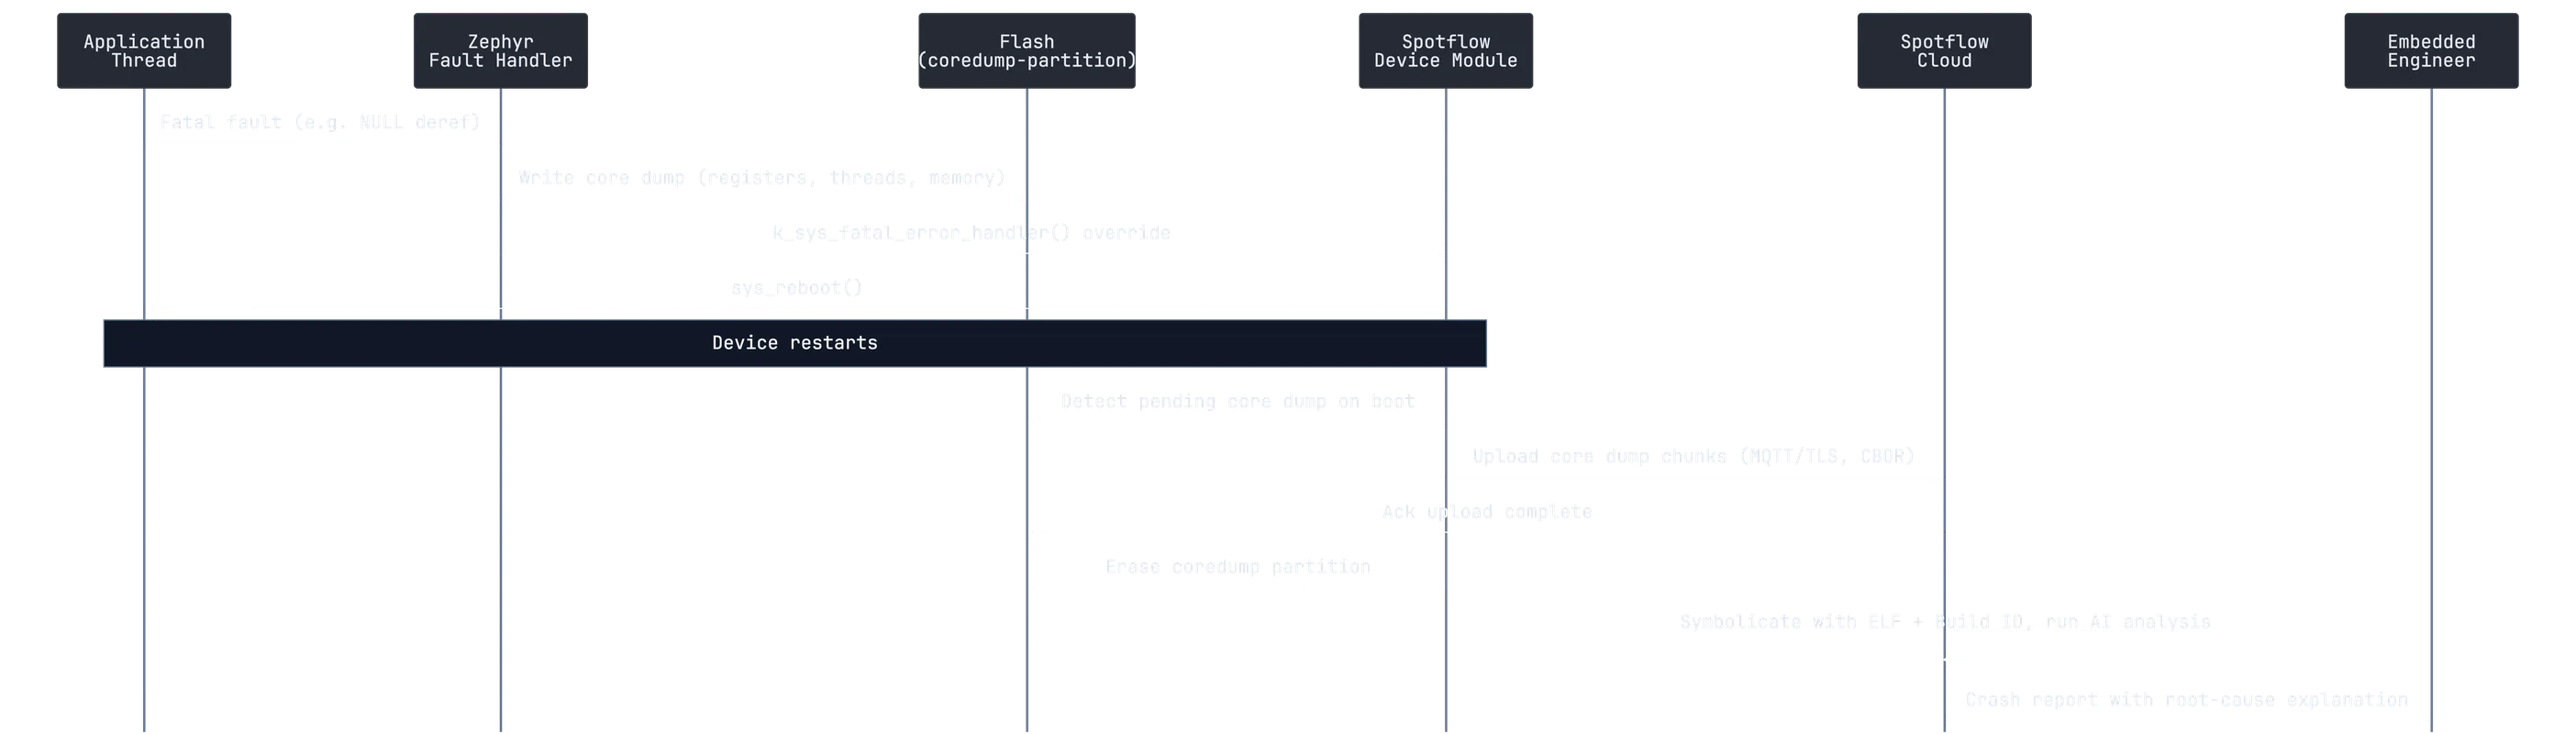
The core dump never depends on connectivity being available at the moment of the crash, because it is written to flash before the reboot happens. Only the upload, which happens afterward, needs the network. Once the ELF file (with symbols) for a given build is uploaded to Spotflow’s Firmware Management, the uploaded core dump is linked to it automatically by build ID, unlocking full symbolication: function names instead of raw addresses, resolved local variables per stack frame, and global variable state at the time of the fault.
Firmware metadata is what ties all of this together across a fleet running more than one version. Every device reports its build ID on connection; the Devices page shows which firmware and version each device is running (once matched against an uploaded symbol file), and every log line and crash report on the Events page carries the same build ID, firmware name, and version. This is what makes it possible to answer “is this crash specific to the new rollout?” instead of only “did this device crash?”
Investigating Field Issues in the Spotflow Portal
Once devices are reporting, the Events Explorer is the single place logs and crash reports both land, filterable by device ID, severity, event type, firmware version, and free-text content:
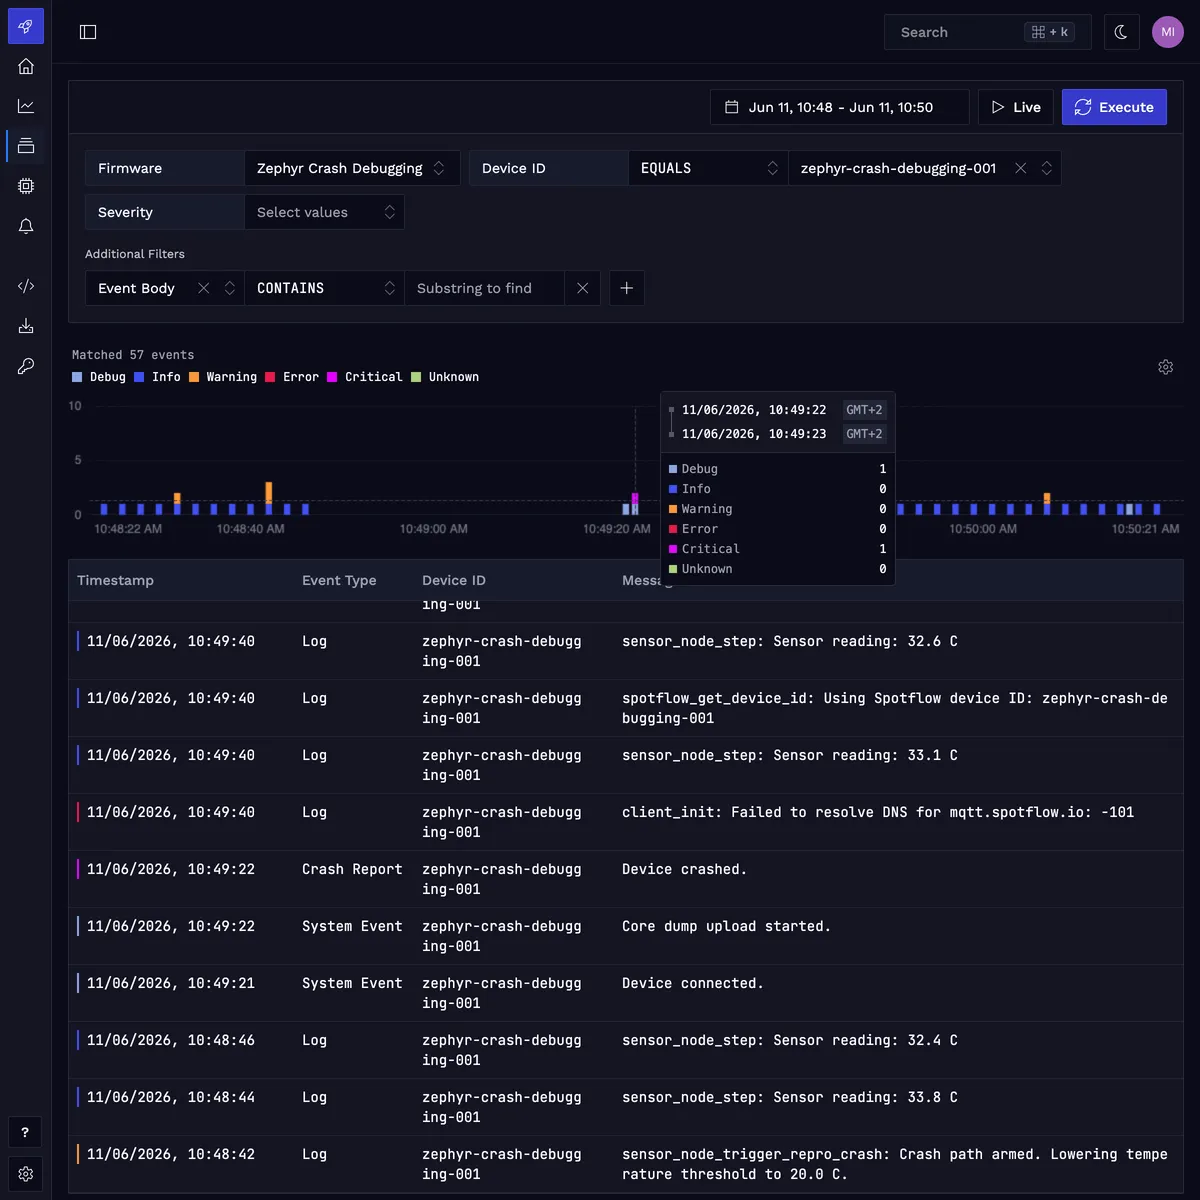
Live log streams show up the same way they would on a UART terminal, just searchable across the whole fleet rather than one board at a time.
Opening a crash event shows the extracted core dump data directly: stack traces per thread with resolved function names, register values and local variables per frame, and global state at the moment of the fault.
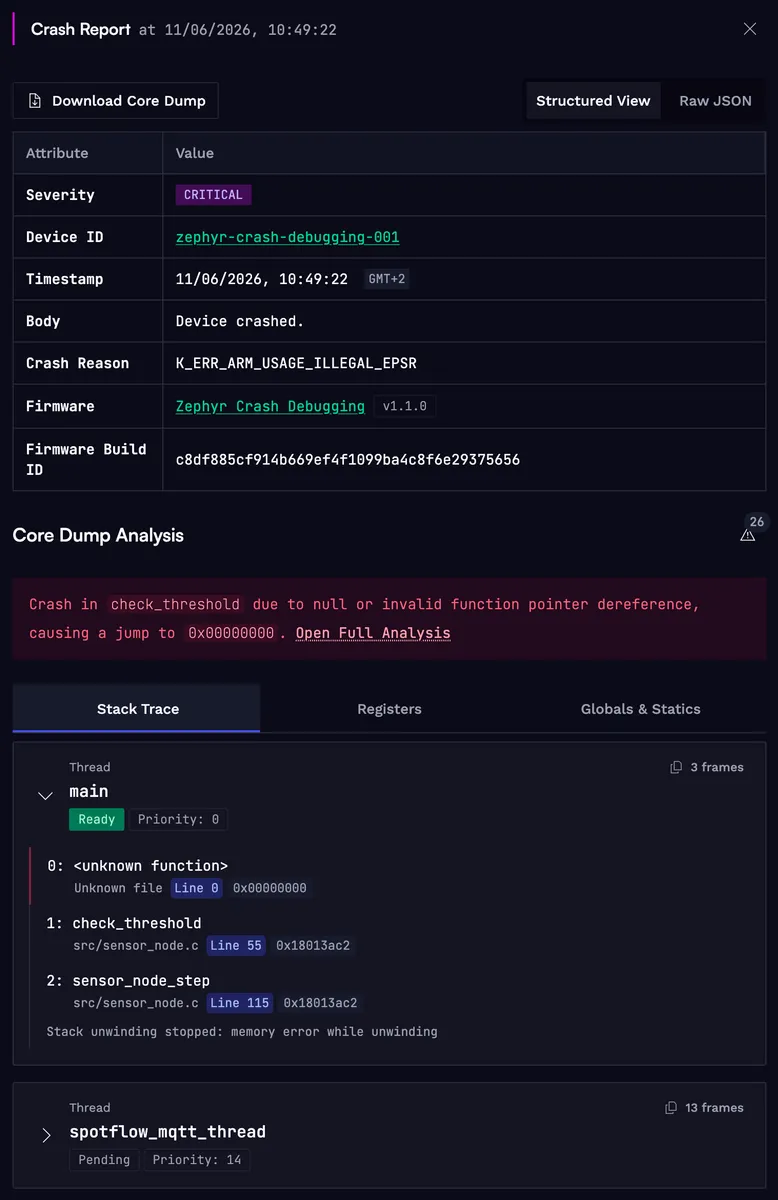
Spotflow’s AI Crash Analysis adds a plain-language root-cause explanation on top of the raw data: which function faulted, what the register state implies (for example, a program counter of 0x00000000 is the signature of a null function-pointer call), and where in the code to look first.
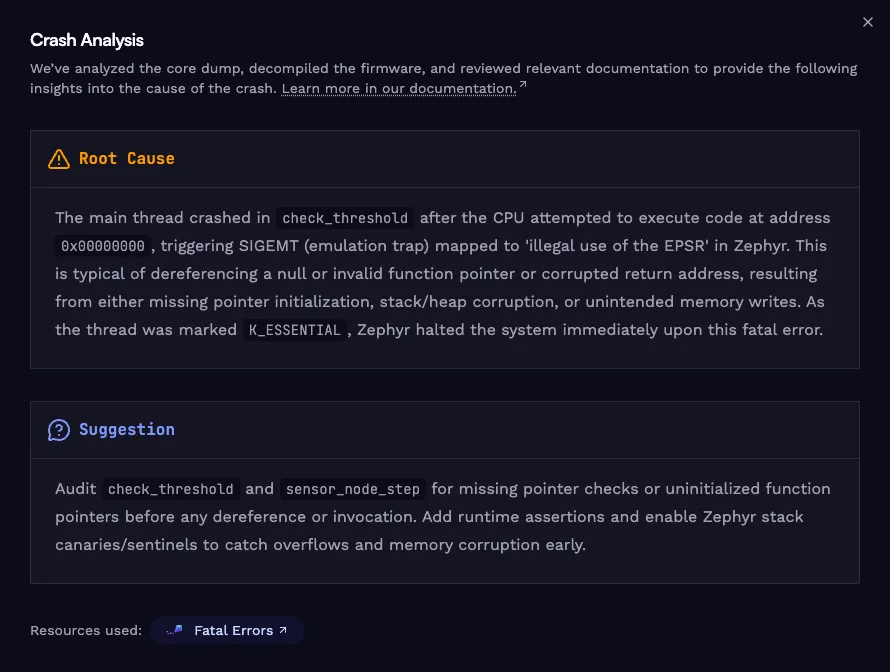
The zephyr-crash-debugging example walks through exactly this scenario end to end: a conditionally registered alert callback that is NULL on one device variant, triggered deterministically, traced from the last warning log through the core dump to the AI-generated explanation. The esp32-industrial-sensor-observability example (Zephyr on ESP32-C3/C6/S3) extends the same idea into a full workflow combining logs, metrics, alert rules, and crash reports for a sensor node with a realistic, gradually degrading failure pattern. The smart-lock-fleet example shows the complementary case: application-specific custom metrics (operation duration, door events, authentication failures) reported through the same Zephyr device module, visualized in custom dashboards alongside crash and log data.
Reduced Debugging Time and Fleet Reliability
Put together, this closes the exact gap described at the start of this post. A crash you cannot observe directly becomes a specific function, call site, and global state you can audit, without a serial cable or a truck roll. A log line that used to only exist on a UART terminal someone happened to be watching now exists searchably across every device that ever emitted it. And because every signal carries a build ID, you can ask fleet-level questions a single device view cannot answer: did the crash rate change after the last OTA rollout, is one hardware batch reconnecting more than another, which firmware version is a specific error trending in. None of this requires a different application architecture. It requires the same LOG_INF() calls and the same Zephyr core dump subsystem you already have, pointed at a transport that survives the trip from the field back to your desk.
Summary
- Start with Zephyr’s native logging subsystem and core dump service during development. They are well designed, well documented, and sufficient for bench debugging on their own.
- Before shipping, make two decisions explicitly: what happens after a fatal error (halt is the default; almost no production device should keep it), and where core dump and log data goes once no one is watching a serial terminal.
- You can build the reboot handler, flash partition, upload path, host receiver, and symbol correlation yourself, or adopt a layer like Spotflow that plugs into the same Zephyr subsystems and handles it for you, with no application code changes.
- Treat firmware metadata (build ID, firmware version) as a first-class signal, not an afterthought. It is what turns “a device crashed” into “devices on v2.3.0 crash at 3x the rate of v2.3.1.”
- Instrument before you need it. The crash or log line you most want is always from a failure that already happened, and it only exists if the pipeline to collect it was already in place.
FAQs
What is embedded observability and how is it different from application monitoring?
Embedded observability is the practice of collecting logs, metrics, events, crash data, and firmware metadata from deployed devices so engineers can determine why a specific device failed, using data it already reported, without physical access. Monitoring tells you something is wrong (a device rebooted, a threshold was crossed); observability lets you investigate why, after the fact, from data collected in advance.
Does Zephyr have built-in remote or cloud logging?
Zephyr’s logging subsystem supports a networking backend (CONFIG_LOG_BACKEND_NET) that sends syslog messages to a network server, but it has no built-in concept of authentication, TLS, offline buffering, or a queryable backend to search the results. It is a basic transport primitive, not a production remote-logging pipeline.
What happens to a Zephyr core dump if no debugger is attached when the device crashes?
If DEBUG_COREDUMP_BACKEND_FLASH_PARTITION is enabled, the dump is written to a dedicated flash partition and survives a reboot, so it is not lost. It stays there until something retrieves and parses it; Zephyr itself does not automatically upload or transmit it anywhere.
How do I stop Zephyr from halting forever after a fatal error?
Provide your own implementation of k_sys_fatal_error_handler() that calls sys_reboot() (after ensuring any core dump write has completed), since Zephyr’s default behavior is to halt the system unconditionally. Device modules like Spotflow’s provide this override automatically when core dump collection is enabled.
How is a Zephyr core dump different from a Linux core file?
Both capture CPU and memory state at the moment of a crash, but Zephyr defines its own binary format (a file header, an architecture-specific register block, an optional thread-metadata block, and one or more memory blocks) rather than reusing the ELF-based ET_CORE format Linux and some other operating systems use. Zephyr provides its own parser and GDB stub scripts to bridge the format to standard GDB.
Do I need to change my LOG_INF() calls or fatal-error handling to add remote observability?
No, if the platform integrates at the backend/subsystem level rather than requiring its own logging or crash API. Spotflow’s Zephyr module, for example, adds itself as an additional logging backend and hooks the existing core dump and fatal-error path; application code is unchanged.
Is Zephyr’s logging and core dump data secure when sent over the network?
Zephyr itself does not define encryption for its native backends. Platforms built on top of it, such as Spotflow, add MQTT over TLS 1.2+ with per-device ingest-key authentication for the actual network transport of logs and core dumps.
Ready to get started? Sign up for Spotflow, no credit card required.
Explore the documentation to go deeper:
- Logging with Zephyr
- Crash reports with Zephyr
- Fundamentals: Logging
- Fundamentals: Crash reports & core dumps
- Fundamentals: Firmware management
- Zephyr Logging documentation
- Zephyr Core Dump documentation
- firmware-observability-examples on GitHub
Questions or feedback? Reach out on Discord or email hello@spotflow.io.